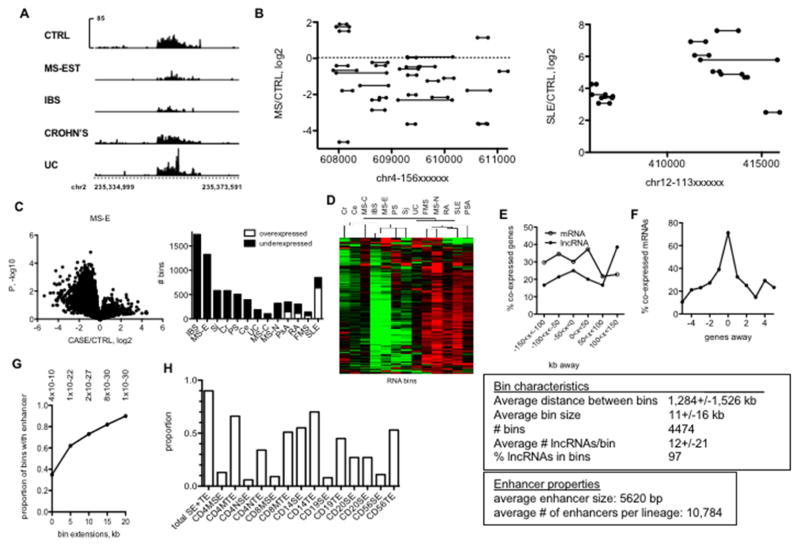
Fig. 2.
Novel IncRNAs are transcribed from discrete locations in the genome (‘bins’) overlapping with known typical and super-enhancers. A, Examples of two genomic regions transcribing a high density of novel IncRNAs (bins). Spikes indicate individual IncRNAs. Y-axes aremean expression of IncRNAs and X-axes are genomic positions on chr1. B, Example of IncRNA bin differentially expressed in the indicated disease cohorts. Y axes are RPKM and X axis is genomic position on chr2. C, Left panel: ‘Volcano’ plots illustrating differential bin activity in MS-E versus CTRL. Right panel: Total numbers of under- and over-expressed ‘bins’ in different idiopathic disease cohorts relative to CTRL after FDR correction. D, Hierarchical clustering of RNA bins across idiopathic disease cohorts after FDR correction. E, Co-expression of bin activity and expression of neighboring IncRNA and mRNA genes. Y-axis is the % of co-expressed genes relative to all genes within the indicated genomic distances of a ‘bin’, X axis is genomic distances from bins. F, Correlation of co-expression of protein-coding genes as a function of distance from a known IncRNA gene. The text box describes overall properties of bins in the genome. G, Relationship between genomic positions of bins and myeloid and lymphoid enhancers. Y-axis is the proportion of bins that contain a myeloid or lymphoid enhancer defined by H3K27Ac levels. X-axis: effect of increasing bin size by the indicated kb in both 5′ and 3′ directions.* = P-values determined by χ2 analysis. H, Proportion of bins that contain enhancers in the indicated lymphoid and myeloid lineages using the bin + 20 kb extension.

