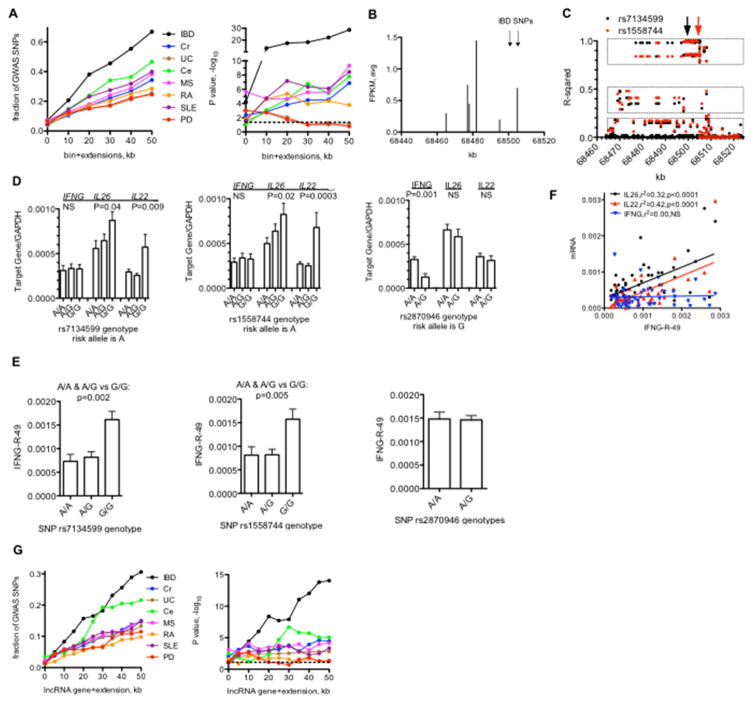
Fig. 5.
LncRNA bins and disease-specific genetic polymorphisms. A, Left panel: Fraction of disease-associated SNPs identified by GWAS studies near novel IncRNA ‘bins’ per disease. Y-axis is the fraction of total SNPs per indicated disease near a IncRNA bin and the X-axis is the bin (0) + indicated extensions in kb from 5′ and 3′ ends. Right panel: P values. −log10 determined by C2 analysis. B, Genomic positions on chr12 transcribing unique IncRNAs (X-axis) relative to transcript level (FPKM avg. of each IncRNA in total sample set). Positions of SNPs associated with IBD are indicated by the arrows. C Linkage disequilibrium across the same genomic region on chr12. Y-axis: Linear regression relative to the indicated IBD-associated SNPs. filled black circles=linear regression compared to rs7134599, filled red circles=linear regression compared to rs1558744. Boxes indicate haplotypes in high (upper), moderate (middle), and low (bottom) linkage disequilibrium with the indicated SNPs. D, Association of IFNG. IL26, and IL22 transcript levels with indicated genotypes. Y-axes are transcript levels in whole blood relative to GAPDH for the given genotypes, rs 7134599 or rs1558744: A/A, N=40, A/C, N=64, G/G, N=32: rs2870946: A/A, N=120, A/G, N=22. E, Association of IFNG-R-49 transcript levels with indicated genotypes, Y-axes are transcript levels in whole blood relative to GAPDH for the given genotypes, subject #s and genotypes as in (d). F, Association between IFNG-R-49 and IFNG, IL26 and IL22 transcript levels in whole blood determined by linear regression analysis. Indicated transcripts normalized to GAPDH, p values are probability that the regression line is non-zero. G, Left panel: Fraction of disease-associated SNPs identified by GWAS studies near annotated IncRNA genes per disease. Y-axis is the fraction of total SNPs per indicated disease near a IncRNA bin and the X-axis is the bin (0) + indicated extensions in kb from 5′ and 3′ ends. Right panel: P values, −log10 determined by C2- analysis. Dashed lines indicate P<0.05.

