
Fig.1. Mass spectrometry of the MSI2 riboproteome and in vivo shRNA screen uncovers the functionally dysregulated RBP network in leukemia.
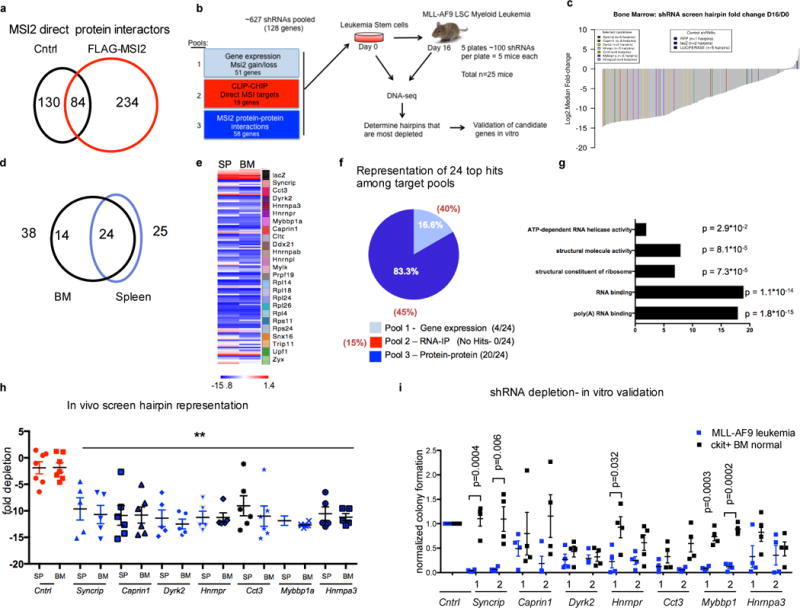
(a) Venn diagram showing mass spectrometry analysis of Flag-MSI2 immunoprecipitation in K562 cells transduced with FLAG-MSI2 or empty vector (b) Summary of the pooled shRNA screening strategy from primary leukemia cells. (c) Waterfall plot depicting normalized depletion levels of all shRNAs in bone marrow (BM). Control shRNAs and hairpins targeting selected candidate genes were highlighted. (d) Venn diagram showing score of 24 hits in bone marrow and spleen samples (e) Heatmap depicting normalized depletion levels of all shRNAs targeting top 24 genes scored both in bone marrow (BM) and spleen (SP). (f) Pie chart showing the scoring percentage of each screening pool in comparison to the predicted score based on pool representation (g) GO analysis of top 24 genes scored in in vivo screen (h) Log2fold depletion in the bone marrow (BM) and spleen (SP) of all the shRNAs against seven candidate genes in the pooled shRNA screen. error bars, s.e.m **p < 0.01 two tailed t test. (i) Colony formation was impaired in KD leukemia cells. Number of formed colonies was normalized to that of control MLL-AF9 leukemia cells or control normal c-kit enriched bone marrow cells. n=4 independent experiments; error bars, s.e.m. P value calculated by two tailed t test.