
Fig.2. SYNCRIP is required to maintain myeloid leukemia survival in vitro and in vivo.
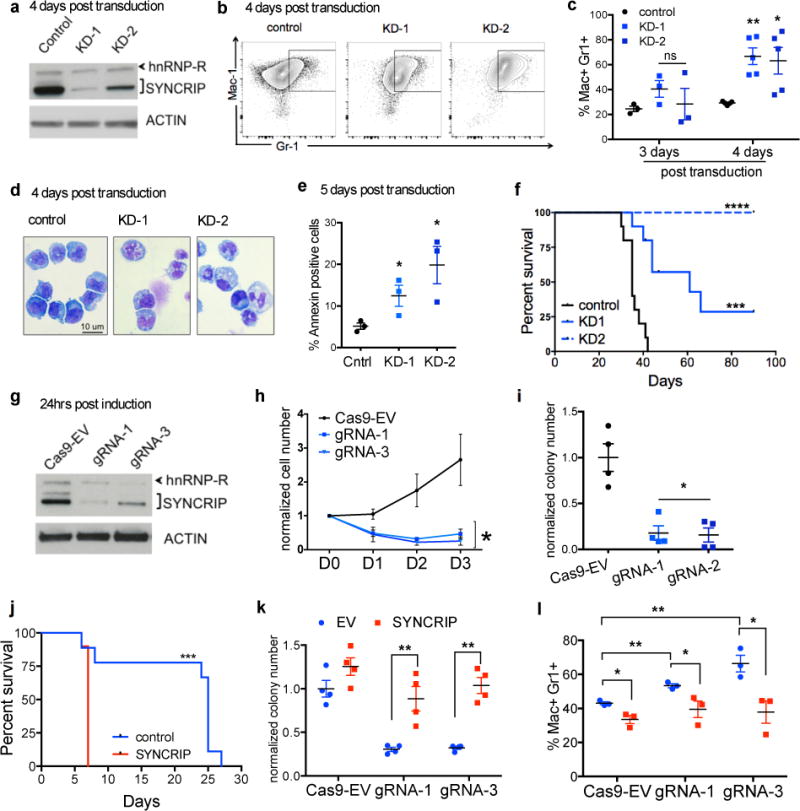
(a) Efficient knockdown of SYNCRIP in mouse MLL-AF9 leukemia cells. (b) shRNA depletion of SYNCRIP promoted myeloid differentiation of leukemia cells. Representative FACS plot of control and SYNCRIP-KD leukemia cells. (c) Quantitative summary of FACS analysis of Gr-1 and Mac-1 expression in control and SYNCRIP-KD leukemia cells 3 days and 4 days post transduction, n=3 and n=5, respectively, independent experiments; error bars, s.e.m. ** p<0.01, * p<0.05 two tailed t test. (d) Giemsa staining of control and SYNCRIP-KD leukemia cells 4 days post transduction. Original magnification 63X, 1.4 NA Scale bars: 10 uM. (e) Annexin-V assessed by flow cytometry 5 days post transduction. n=3 independent experiments; error bars, s.e.m. ** p<0.01, * p<0.05 two tailed t test. (f) Kaplan Meier analysis of leukemia-free survival after injection of SYNCRIP depleted or control cells into sub-lethally irradiated mice. n=10 for each group, Mantel-Cox test *** p<0.001, **** p<0.0001. (g) Reduction of SYNCRIP expression in MLL-AF9 leukemia cells with mutant NRAS expressing a rtTA (RN2 cells) and transduced with tet(O)-inducible Cas9-GFP expressing guide RNAs specific for Syncrip (gRNA1 and gRNA3) or Cas9-GFP empty gRNA (Cas9-EV). (h) Cells from g plated and counted for cellular growth control (black) and two gRNAs (blue). n=3 independent experiments; error bars, s.e.m. * p<0.05 two tailed t test (i) Cells from g were plated into methylcellulose colony assay. n=4 independent experiments; error bars, s.e.m. * p<0.05 two tailed t test (j) Kaplan Meier analysis of leukemia-free survival after injection of RN2 cells overexpressing SYNCRIP or carrying control- empty vector into sub-lethally irradiated mice n=10 for each group, Mantel-Cox test *** p<0.001 (k) Overexpression of SYNCRIP rescued colony forming ability of RN2 cells depleted of endogenous SYNCRIP. n=4 independent experiments; error bars, s.e.m. ** p<0.01 two tailed t test. (l) Quantitative summary of FACS analysis of Gr-1 and Mac-1 expression in Cas9-EV and Syncrip-gRNAs transduced leukemia cells in k. n=3 independent experiments; error bars, s.e.m. *p<0.05, ** p<0.01 two tailed t test.