
Fig.3. SYNCRIP is required for leukemogenesis in vivo.
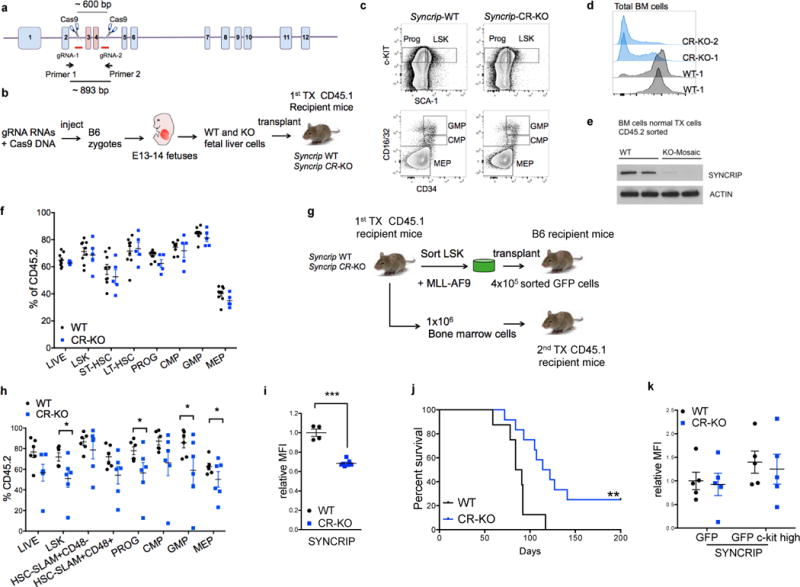
(a). Diagram depicts Syncrip locus and CRISPR/Cas9 targeting strategy for generation of Syncrip-CR-knockout (KO) and (b) experimental scheme for generation of hematopoietic Syncrip-CR-KO using CRISPR/Cas9 approach and bone marrow transplantation of fetal liver cells. (c) Representative FACS analysis of hematopoietic stem and progenitor cells in WT and Syncrip-CR-KO fetal livers. (d) Representative FACS histograms of SYNCRIP intracellular staining and (e) immunblot analysis of CD45.2 positive bone marrow cells isolated from WT and Syncrip-CR-KO recipient mice. (f) Quantitative summary of FACS analysis of hematopoietic stem and progenitor compartments in WT and Syncrip-CR-KO recipient mice. LIVE: total bone marrow cells; LSK: Lin-Sca1+Kit- cells; PROG: Progenitor cells; GMP: Granulocyte Macrophage progenitor; CMP: Common Myeloid progenitor; MEP: Megakaryocyte-Erythrocyte progenitor. WT n=9; CR-KO n=5. (g) Experimental scheme for LSK-derived MLL-AF9 initiation leukemia transplantation model and secondary bone marrow transplantation. (h) Quantitative summary of FACS analysis of hematopoietic stem and progenitor compartments in WT and Syncrip-CR-KO secondary recipient mice. WT n=6; CR-KO n=6, error bars, s.e.m. *p<0.05 two tailed t test. (i) Quantitative summary of relative median fluorescence intensity (MFI) analysis of SYNCRIP intracellular staining of engrafted CD45.2 cells in WT and Syncrip-CR-KO secondary recipient mice. WT n=4; CR-KO n=7 error bars, s.e.m. ***p<0.001 two tailed t test. (j) Kaplan Meier analysis of leukemia free survival after injection of MLL-AF9 transformed WT and Syncrip-CR-KO cells into lethally irradiated mice WT n=8, Syncrip-CR-KO n=12; Mantel-Cox test ** p<0.01. (k) Quantitative summary of relative MFI analysis of SYNCRIP intracellular staining of GFP positive and GFP positive c-kit high cells from mice succumbed to leukemia in WT vs. Syncrip-CR-KO. WT n=5; CR-KO n=5.