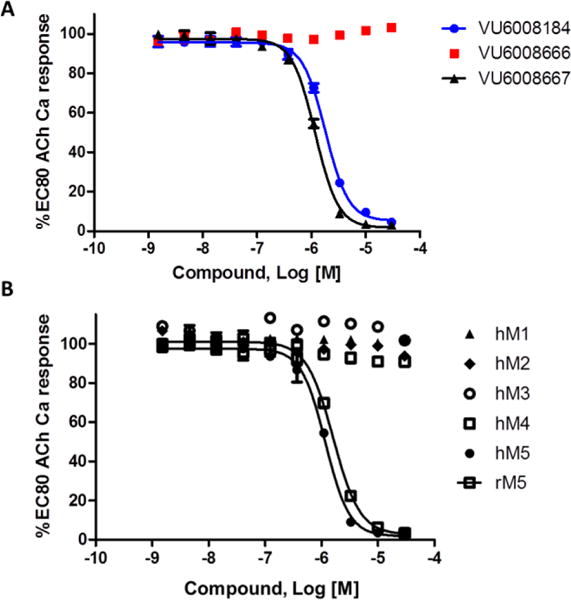
Figure 3. Molecular pharmacology profile of M5 NAMs 9–11.

A) hM5 concentration response curves (CRCs) for 9, 10 and 11; B) mAChR CRCs for hM1–5, highlighting the exquisite selectivity for (S)-11 as an M5 NAM, as well as rat M5, showing no significant species differences. Data represent means from at least three independent determinations performed in triplicate via intracellular calcium mobilization assays in recombinant Chinese Hamster Ovary (CHO) cells stably transfected with the individual mAChRs.
