Figure 2.
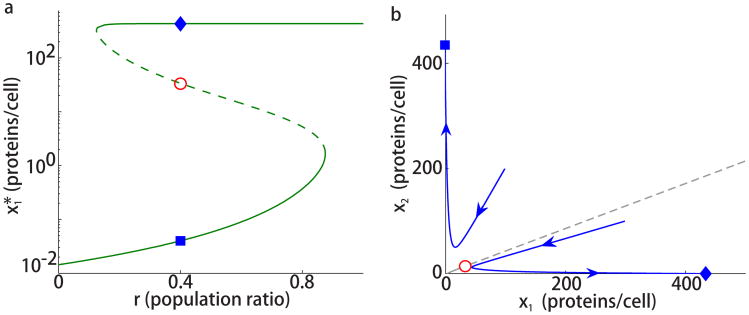
Two-strain population toggle with equal growth rates. (a) The equilibrium
as a function of population ratio r. The dashed and solid lines correspond to unstable and stable equilibria, respectively. (b) Two trajectories of Eq. (1) approaching one of the two stable equilibria marked by (
 ) and (
 ) based on the initial conditions. The third, unstable equilibrium is denoted by (
 ). The gray dashed line shows the separatrix between the two basins of attraction of the stable equilibria. The parameters are chosen as β1 = β2 = 0.023 min−1 corresponding to E. coli's cell cycle of approximately 30 minutes, α = 10 min−1, θ = 500, N = 200, and n = 2. The simulations are carried out for constant population ratio r = 0.4 and initial conditions (x1(0), x2(0)) = (100, 200) proteins per cell and (x1(0), x2(0)) = (300, 100) proteins per cell.

