Figure 6.
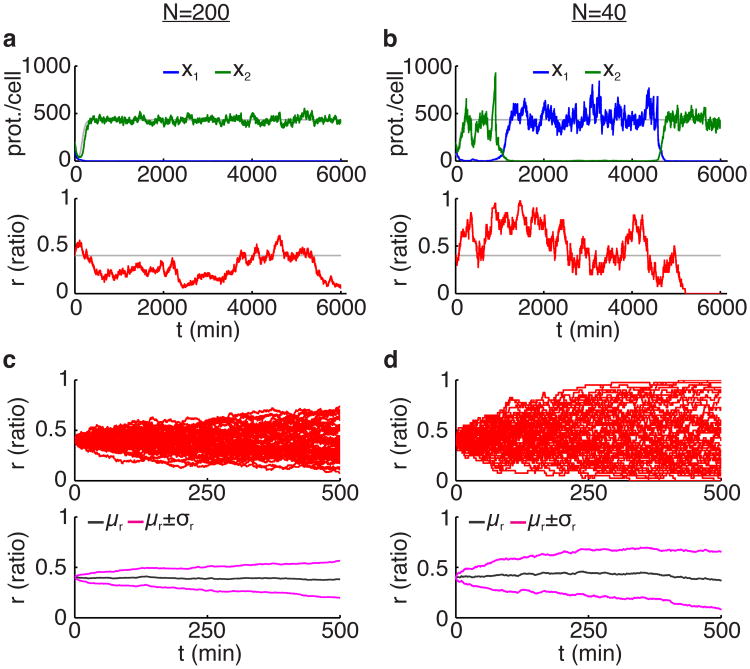
Stochasticity in the dynamics of the two-strain toggle consortium. (a,b) Simulations of Eqs. (8)-(11) with no metabolic loading (ρ = 0) and equal growth rates (ε = 0) for different population sizes as indicated. The blue and green curves show the mean number of proteins in strains 1 and 2, respectively. The red curve shows the population ratio. Simulations of the deterministic system from Eqs. (1) and (4) are also shown using gray curves. Parameters are the same as in Fig. 4. Initial protein counts are x1,i(0) = 100, i = 1, …, n1, x2,j(0) = 200, j = 1, …, n2, and initial ratio of strain 1 is r(0) = 0.4. (c,d) Different stochastic simulations of the population ratio corresponding to panels (a,b), respectively, as well as the mean (μr) and the standard deviation (σr).

