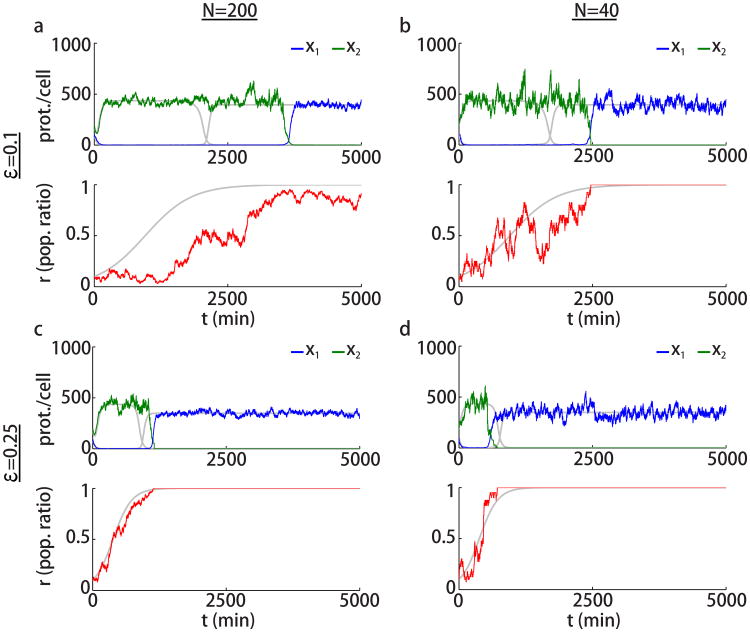
Figure 7.
Simulations of Eqs. (8)-(11) with unequal growth rates of the strains and no metabolic loading (ρ = 0) with different ε and N values as indicated. The gray curves show the corresponding simulations of the deterministic model. Parameters are the same as in Fig. 4. Initial conditions are x1,i(0) = 100 proteins, i = 1 …, n1, x2,j(0) = 200 proteins, j = 1, …, n2, and initial ratio of strain 1 is r(0) = 0.1.

