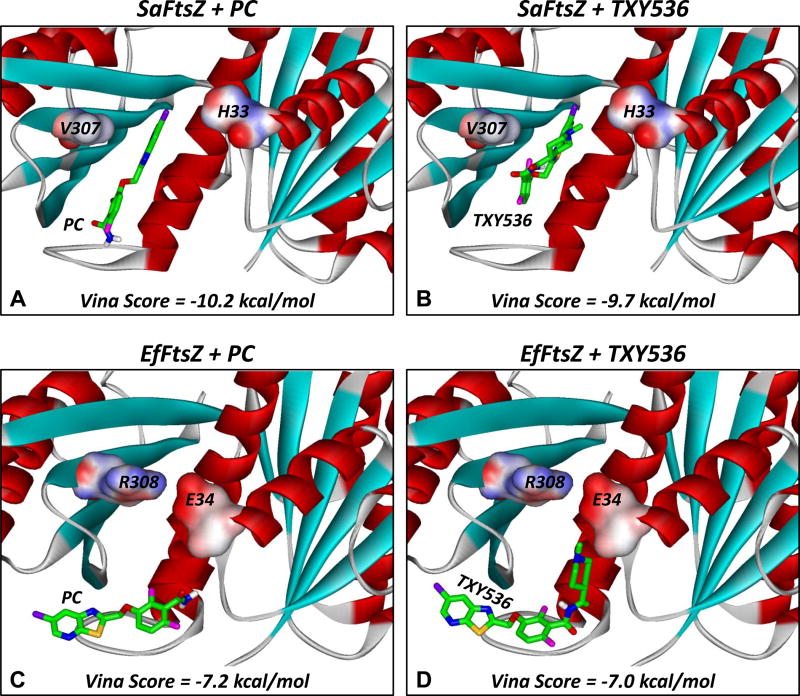
Fig. 6.
Docked structures of PC (A,C) and TXY536 (B,D) in complex with SaFtsZ (A,B) and EfFtsZ (C,D). The compounds were docked using the AutoDock Vina algorithm, with the top scoring binding orientations being depicted and their associated scores indicated. The structure of SaFtsZ is derived from the reported crystal structure (PDB # 4DXD) [38], while the structure of EfFtsZ is a homology model built as described in the Materials and Methods. The FtsZ proteins are depicted according to their secondary structural elements (α-helices in red, β-strands in cyan, and loops in gray). The residues at positions 33/34 and 307/308 are portrayed in their solvent accessible surfaces and color-coded according to electrostatic potential (blue for positive, red for negative, and white for neutral). The compounds are shown in stick format and color-coded according to atom (carbon in green, nitrogen in blue, oxygen in red, sulfur in yellow, fluorine in magenta, and chlorine in violet).

