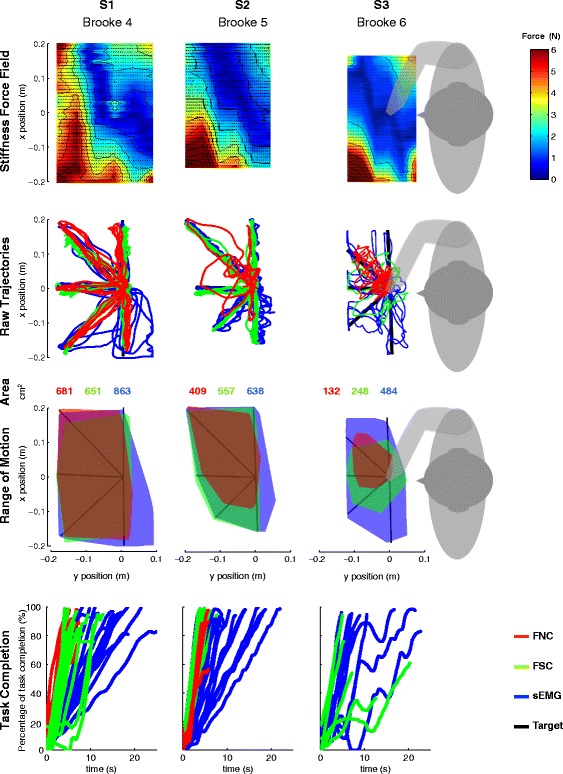
Fig. 6.

Stiffness force-fields, raw trajectories, reachable ROM and percentage of task completion over time. Data presented for each subject (columns) and each metric (rows). Stiffness force fields present similarities over participants with maximum stiffness forces of 6 N at the upper-left corner of the participant’s workspace and a region of low stiffness force going from the center of their chest to the right upper side of their workspace. Smoothness of the trajectories, reachable ROM and percentage of task completion rate differed with the level of arm function of the participants. Note that the FNC control method was not usable for subject S3 (Brooke 6)
