
FIGURE 1.
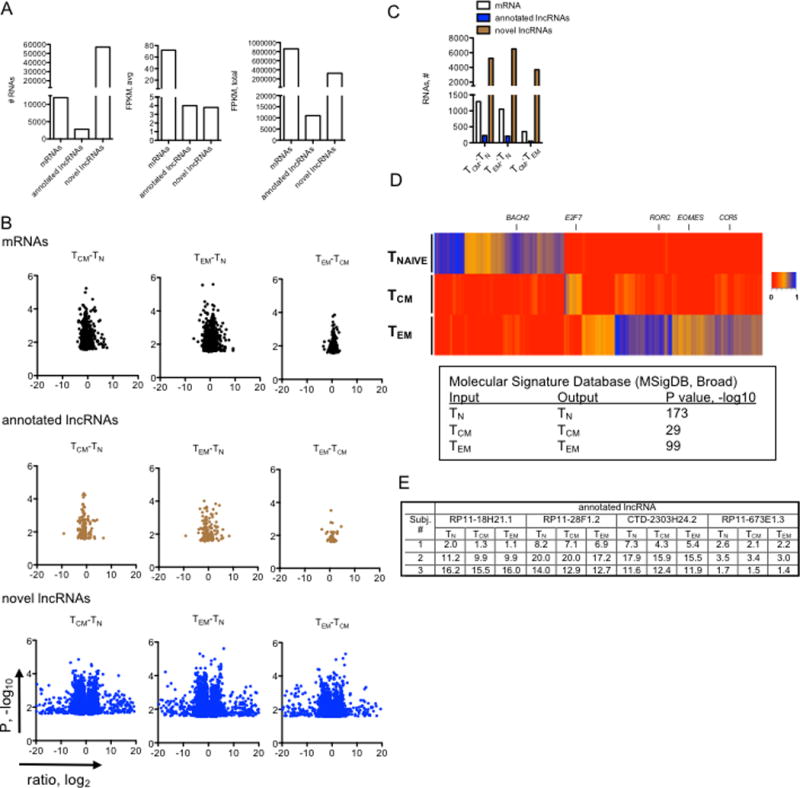
Cell-type specific expression of mRNAs and lncRNAs. (A) Left panel, total numbers of mRNAs (GRCh38 release, total protein-coding genes=19950), annotated lncRNAs (GRCh38 release, long non-coding genes=15767) and novel lncRNAs detected here by de novo assembly with average FPKM > 1 in at least one cell lineage; middle panel, average expression levels of the different RNA classes in TN, TCM and TEM cells; right panel, total expression levels of the indicated RNA classes in TN, TCM and TEM cells (N=3). (B) Volcano plots identifying lineage specific RNA classes after FDR correction, P < 0.05. X-axis represents the indicated expression ratios, log2, and the Y-axis is P value, -log10. (C) Total numbers of mRNAs, annotated lncRNAs and novel lncRNAs that show lineage specific expression (from (B). (D) Hierarchical clustering showing expression levels of mRNAs expressed by human CD4+ T cells determined by whole genome RNA-seq aligned to hg38 (N=3). A scale bar is adjacent to the heat map. MSigDB analysis of lineage-specific mRNAs (identified in the heatmap) as input, outputs from the MSigDB analysis are shown with corresponding P-values. (E) Individual variation in lncRNA expression. Expression levels in FPKM of four annotated lncRNAs are shown in TN, TCM and TEM subsets isolated from three individual subjects.