
FIGURE 2.
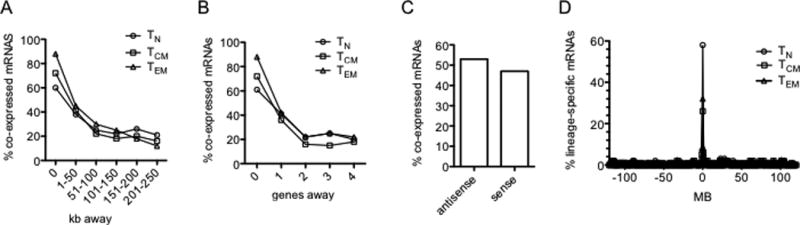
Relationships between genomic positions of co-expressed lineage specific protein-coding genes and annotated lncRNA genes. (A) Results are expressed as the % of lineage-specific mRNA genes (○, TN; □, TCM; Δ, TEM) co-expressed with lineage-specific annotated lncRNA genes relative to total mRNA genes within the indicated distance in kb from a lineage-specific annotated lncRNA gene. (B) As in (A) except results are expressed relative to the number of genes in the genome away from the lineage-specific annotated lncRNA gene. (C) Percentage of co-expressed lineage-specific mRNA genes transcribed in antisense or sense orientations relative to adjacent co-expressed lineage-specific annotated lncRNA genes. (D) Genes encoding lineage-specific mRNAs are enriched in the genome near lineage-specific annotated lncRNA genes. The y axis is the percent of total lineage-specific TN, TCM and TEM mRNAs (Fig 1, heatmaps). The x axis is the distance of the gene encoding a lineage-specific mRNA from the nearest gene encoding a lineage-specific annotated lncRNA. P values determined by c2 analyses, TN; P = 10−22, TCM; P=10−12, TEM; P=10−14.