
FIGURE 3.
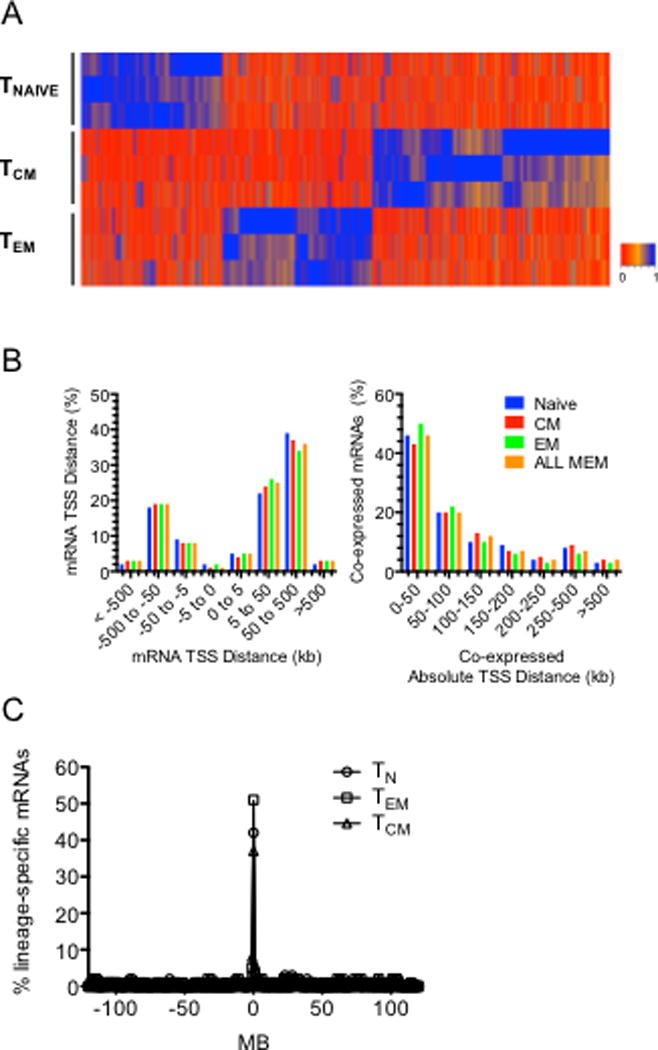
Discovery of lineage-specific novel lncRNAs. (A) Hierarchical clustering showing expression levels of novel lncRNAs expressed by human CD4+ TN, TCM and TEM cells determined by whole genome RNA-seq aligned to hg19 (N=3). (B) Co-localization of genes encoding lineage-specific mRNAs and novel lncRNAs in the genome. Left panel: % of lineage-specific protein-coding genes that are within the indicated distance in kb from another lineage-specific protein-coding gene, right panel: % of lineage-specific protein-coding genes that are within the indicated distance in kb from a co-expressed lineage-specific novel lncRNA-coding gene. (C) Genes encoding lineage-specific mRNAs are enriched in the genome near lineage-specific novel lncRNA loci. The y axis is the percent of total lineage-specific TN, TCM and TEM mRNAs (Fig 1, heatmaps). The x axis is the distance of the gene encoding a lineage-specific mRNA from the nearest loci encoding a lineage-specific novel lncRNA, P values determined by c2 analyses, TN, P = 10−21; TCM, P=10−14; and TEM P=10−19.