
FIGURE 4.
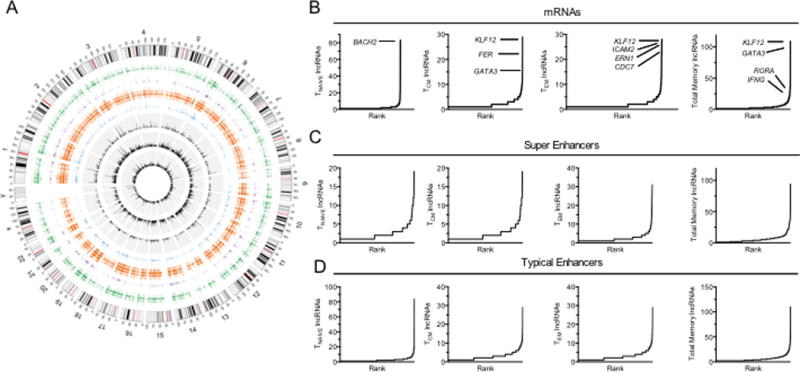
Relationships among lineage-specific lncRNAs and transcriptional enhancers. (A) Circosplot depicting genome-wide positions of CD4 naïve typical enhancers and super enhancers (purple) along with CD4 memory typical enhancers (orange) and super enhancers (blue) in the outer rings (from ref. 20). Bar graphs colored in black in the inner concentric circles show lineage specific novel lncRNAs in naïve (outermost), central memory, and effector memory (innermost) cells (B) Lineage specific mRNAs ranked by number of lineage-specific novel lncRNAs per gene loci. Ranks of certain gene loci are noted in the graphs. (C) Lineage-specific SE are ranked by number of novel lncRNAs per genomic locus. (D) Lineage-specific TEs are ranked by number of novel lncRNAs per genomic locus.