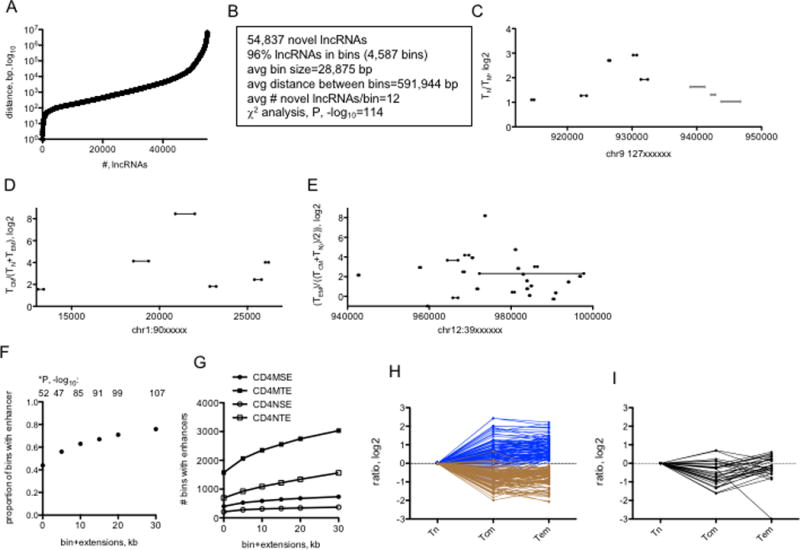
FIGURE 5.

Genomic distributions of novel lncRNAs. (A) Distances between genomic loci transcribing unique novel lncRNAs. The X-axis ranks novel lncRNA loci according to distance to the next novel lncRNA loci and the Y-axis shows the actual distance in bp between neighboring lncRNA loci. (B) Characteristics of genomic ‘bins’ transcribing multiple novel lncRNAs. (C, D, & E) Examples of genomic bins selectively transcribing multiple novel lncRNAs in (C) TN relative to TM, D) TCM relative to TN and TEM, and (E) TEM relative to TN and TCM. X-axes show genomic positions from which novel lncRNAs are transcribed; lines illustrate sizes of the transcribed novel lncRNA. Y-axes are mean expression ratios, log2, between the indicated T cell lineages. (F) Genomic bins transcribing novel lncRNAs co-localize with TN and TM typical and super transcriptional enhancers (from ref. 20). We considered that the genomic bins may not exactly overlap with enhancers so we performed the analysis to include the proportion of bins that co-localize with an enhancer (0), and the proportion of bins that co-localized with enhancers if we extended bin size by 5, 10, 15, 20 or 30 kb in both 5’ and 3’ directions, X-axis. The Y-axis is the proportion of total bins with a TN or TM enhancer. P values, -log10, were determined by c2 analysis. (G) Number of bins within TM SE or TE (CD4MSE, CD4MTE) structures or TN SE or TE structures. X-axis is as in (F), Y axis is the number of bins with enhancers. (H&I) Re-analysis of RNA-seq data using ‘bins’ as definition lists. (H) After FDR correction, bins were identified that were over-expressed (blue lines) or under-expressed (brown lines) in TCM and TEM cells compared to TN cells. (I) Expression levels of bins differentially expressed in TCM relative to TN and TEM after FDR correction. Y-axes are expression ratios, log2, X-axes identify ratios; Tn=TN/TN, Tcm=TCM/TN, Tem=TEM/TN.
