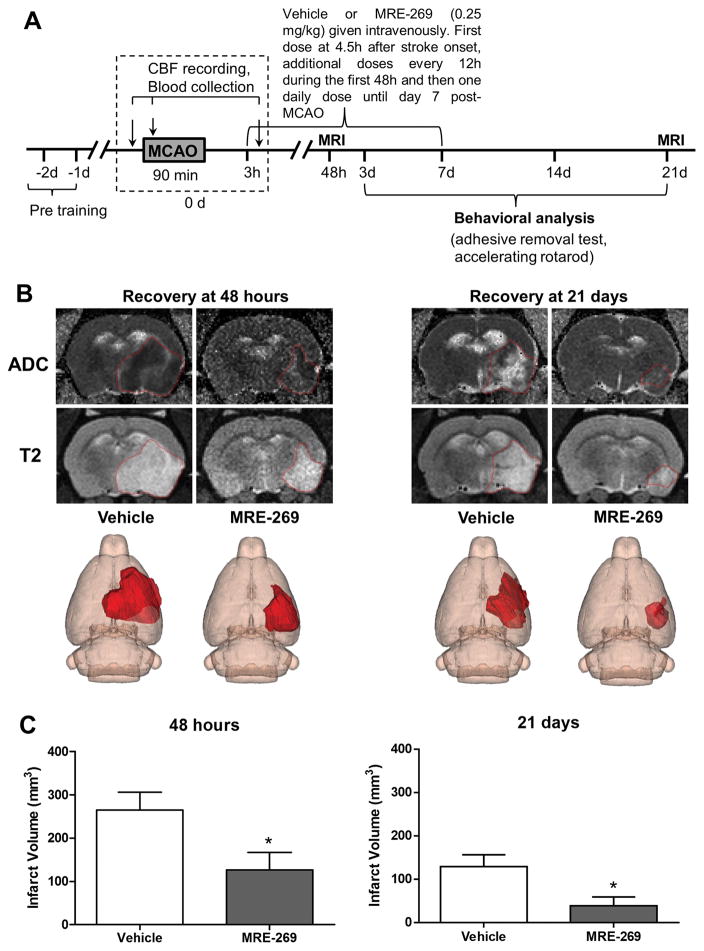
Figure 1. Delayed treatment with the highly selective IP receptor agonist, MRE-269, significantly reduced infarct volume in aged rats subjected to ischemic stroke.
A) Timeline of MRE-269 administration, MRI scanning and behavioral testing. B) Representative ADC, T2-weighted MRI scans and 3D reconstruction images of the ischemic lesion in vehicle- and MRE-269-treated rats are shown in panel B. The ischemic area was marked with a discontinuous red line in ADC and T2 images and depicted as a dark red area in the right hemisphere in 3D maps. Quantification of infarct volume at 48 h and 21 days (C) showed a marked neuroprotective effect of delayed MRE-269 administration. Data were expressed as mean ± SEM, *P<0.05 versus vehicle. At 48 h, n=11 for vehicle and n=10 for MRE-269; At 21 days, n=8 for vehicle and n=9 for MRE-269, respectively.

