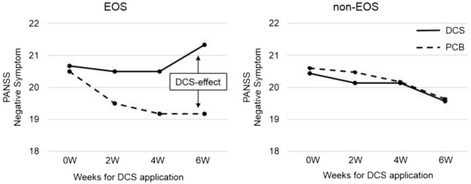
Fig. 2.

Changes in the scores of PANSS negative symptom
PANSS, Positive and Negative Syndrome Scale; DCS-effect was defined by scores at DCS phase subtracted by those at PCB phase. In the non-EOS group, the scores for both DCS and PCB declined as time proceeded and almost no difference (−0.07) was noted in the DCS-effect at 6 W. In the EOS group, the score for PCB declined as time proceeded whereas the one for DCS demonstrated less decline or even an increase, resulting in the positive value (+2.2) for the DCS-effect at 6 W
