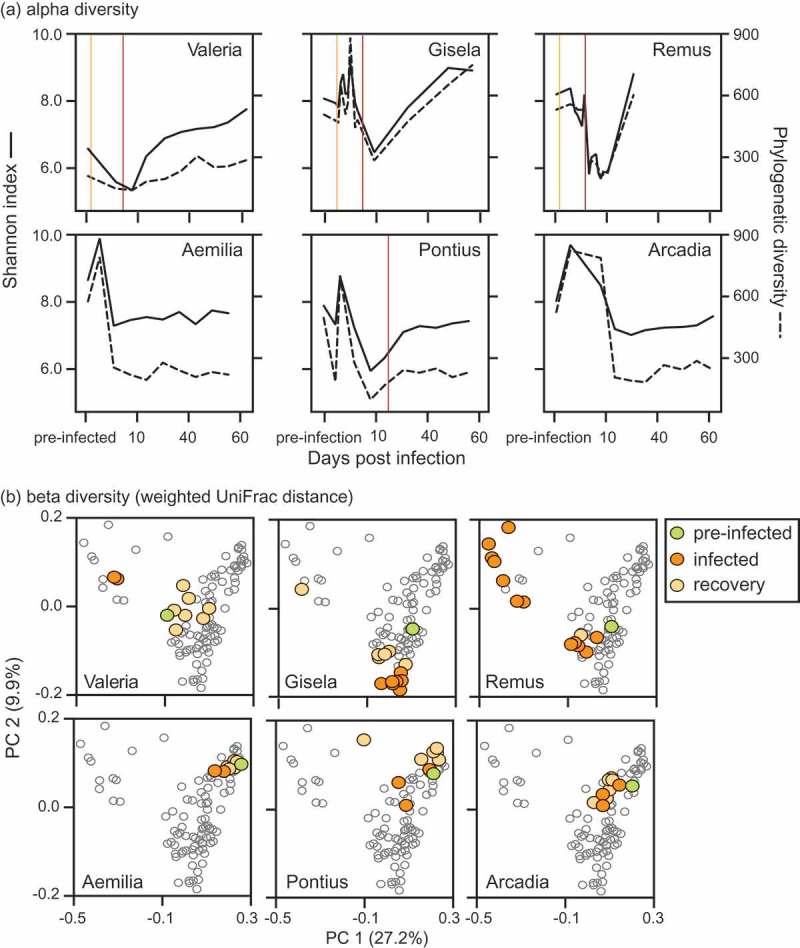
Figure 6.

Trajectories for individual sifakas during infection and recovery relative to measures of gut microbial (a) alpha and (b) beta diversity. (a) Shannon index (solid lines) incorporates species richness and evenness, whereas phylogenetic diversity (dashed lines) quantifies taxonomic relatedness across communities. Vertical lines mark the onset of antimicrobial (orange) and antibiotic (red) treatments. (b) Principal coordinates analysis plots of UniFrac distance, weighted by relative abundance.
