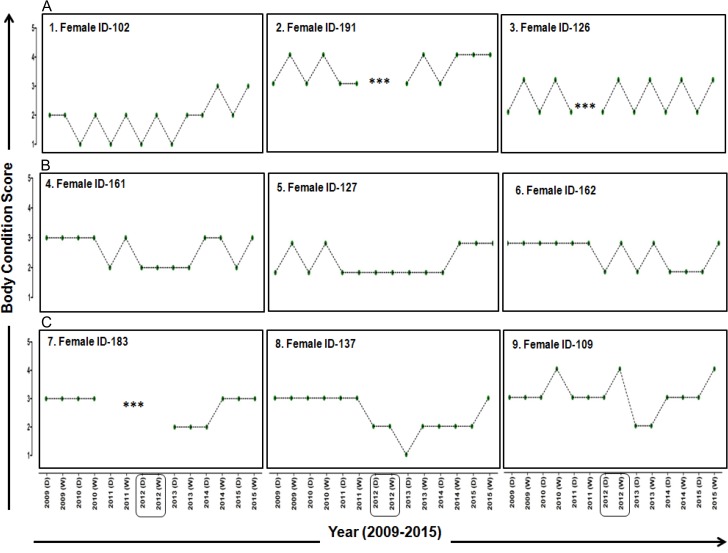
Figure 2:
Changes in BCS of nine adult female elephants between dry and wet seasons from 2009 to 2015. The X-axis represents seasons (D = dry and W = wet) through the period 2009–2015, and the Y-axis represents BCS. Each plot represents changes in BCS for each adult female. Panels ‘A’, ‘B’ and ‘C’ represent individuals exhibiting similar profiles of change in BCS. Symbols represent: ***: not sighted;  : Drought year.

