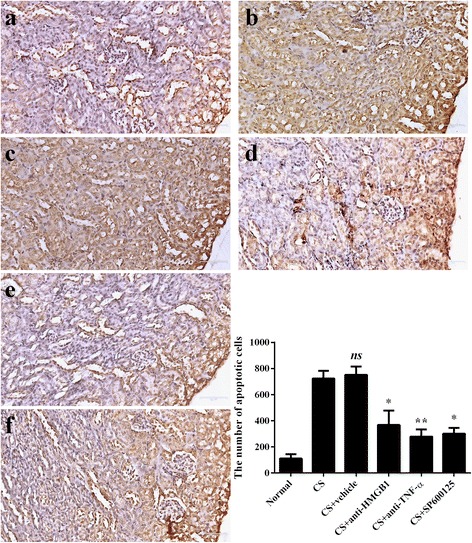
Fig. 4.

TUNEL staining label apoptotic cells in the renal cortex at 12 h after releasing (×200). Positive cells are dark brown. There are 6, 7, 7, 10, 10, 9 mice in the normal (a), CS (b), CS + vehicle (c), CS + anti-TNF-α antibody (d), CS + anti-HMGB1 antibody group (e), and CS + SP600125 (f), respectively. The number of positive cells was calculated in 5 fields in each section, and in 5 sections from each mouse. Results are described as mean ± SD. ** p < 0.01, * p < 0.05, ns p > 0.05 vs. the CS + vehicle group
