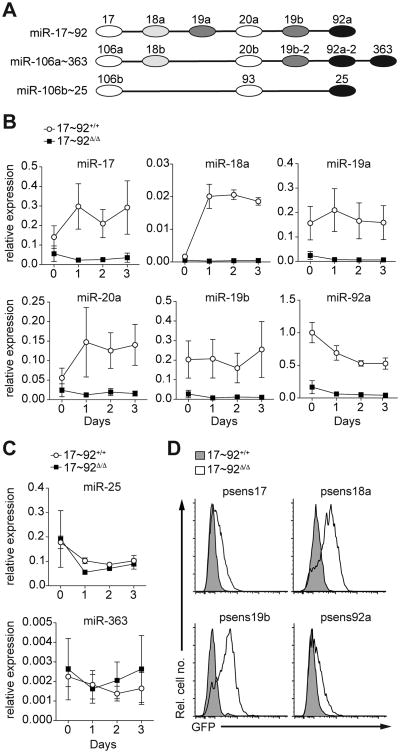
Figure 1. miR-18a is active and dynamically regulated during Th17 cell differentiation.
(A) Schematic of miRNAs within the miR-17∼92 cluster and its paralogous miRNA gene clusters miR-106a∼363 and miR-106b∼25. Individual miRNA families represented in the three clusters are color-coded. (B, C) Naive control (17∼92+/+; circles) and miR-17∼92-deficient (17∼92Δ/Δ; squares) CD4+ T cells were cultured in vitro under Th17-polarizing conditions. Cells were harvested at the indicated time points and quantitative real-time PCR was performed to determine expression levels of individual miRNAs of the miR-17∼92 cluster (B) or representative miRNAs from the paralogous miRNA gene clusters miR-106b∼25 and miR-106a∼363 (C); expression was normalized to 5.8S rRNA in each sample. (D) 17∼92+/+ and 17∼92Δ/Δ CD4+ T cells were transduced with retroviral sensors expressing EGFP together with 4 perfectly complementary binding sites for miR-17 (psens17), miR-18a (psens18a), miR-19b (psens19b) or miR-92a (psens92a) in the 3′UTR and analyzed by flow cytometry. Data are pooled from three independent experiments, each with one mouse per genotype (B, C; error bars represent s.e.m.) or are representative of four independent experiments, each with one mouse per genotype (D).

