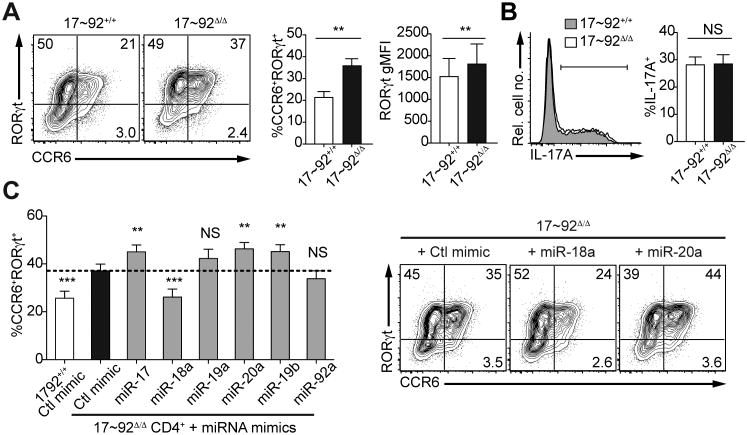
Figure 2. miR-18a inhibits Th17 cell differentiation.
Naive 17∼92+/+ and 17∼92Δ/Δ CD4+ T cells were cultured in vitro under Th17 conditions (TGFβ+IL-6) and analyzed on day 3.5 for Th17 marker expression by flow cytometry. (A) Representative contour plots show surface CCR6 and intracellular RORγt co-staining of live singlet CD4+ T cells. Frequencies of CCR6+ and CCR6+RORγt+ cells as well as the RORγt geometric mean fluorescence intensity (gMFI) are quantified in the bar graphs. (B) IL-17A production after restimulation with PMA/ionomycin is shown in a representative histogram and the frequency of IL-17A+ cells is quantified in the bar graph. (C) Naive 17∼92+/+ and 17∼92Δ/Δ CD4+ T cells were cultured under Th17-polarizing conditions and transfected on day 2 with control miRNA mimics (Ctl mimic) or miRNA mimics of the individual miR-17∼92 cluster members. Cells were analyzed on day 3.5 for Th17 marker expression by flow cytometry. The frequencies of CCR6+RORγt+ cells among CD4+ T cells are shown in the bar graph; representative contour plots display surface CCR6 expression and intracellular RORγt co-staining of CD4+ T cells. Numbers in quadrants indicate percent CCR6 and/or RORγt-positive live singlet cells. **P<0.01 and ***P<0.001 (two-tailed paired t-test with pre-assigned littermate pairs (A, B) or one-way ANOVA with Dunnett's multiple comparison post-test comparing all columns to control miRNA mimic-transfected 17∼92Δ/Δ CD4+ T cells (C)). Data are pooled from five (C), or six to eight (A, B) independent experiments, each with one to two mice per genotype (mean and s.e.m.; A-C).

