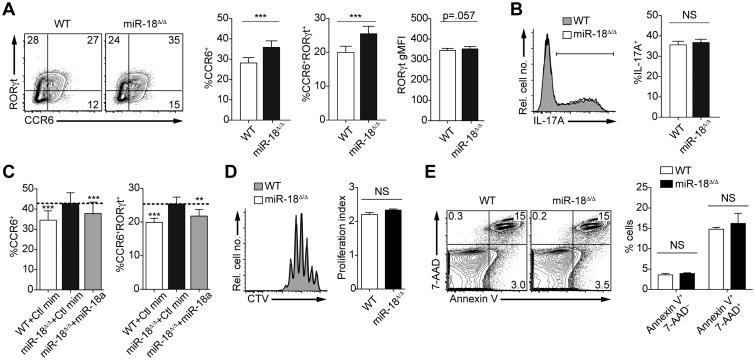
Figure 3. Genetic ablation of miR-18a alone increases the frequency of CCR6+ and CCR6+RORγt+ CD4+ T cells.
Naive wildtype (WT) and miR-18Δ/Δ CD4+ T cells were cultured in vitro under Th17 conditions (TGFβ+IL-6) and analyzed on day 3.5 for Th17 marker expression by flow cytometry. (A) Representative contour plots show surface CCR6 and intracellular RORγt co-staining of live singlet CD4+ T cells. Frequencies of CCR6+ and CCR6+RORγt+ cells as well as the RORγt gMFI are quantified in the bar graphs. (B) IL-17A production after restimulation with PMA/ionomycin is shown in a representative histogram and the frequency of IL-17A+ cells is quantified in the bar graph. (C) Naive WT and miR-18Δ/Δ CD4+ T cells were cultured under Th17-polarizing conditions and transfected on day 2 with control miRNA mimics (Ctlmim) or miR-18a mimics. Cells were analyzed by flow cytometry on day 3.5. The frequencies of CCR6+ and CCR6+RORγt+ cells are quantified in the bar graphs. (D) Representative histograms show CellTrace Violet (CTV)-labeled cells assessed on day 3.5 of culture. Proliferation indices are quantified in the bar graph. (E) Frequencies of early apoptotic (Annexin V+ 7-AAD–) and late apoptotic/dead cells (Annexin V+ 7-AAD+) among WT and miR-18Δ/Δ CD4+ T cells were assessed by flow cytometry on day 3.5 of Th17 culture. **P<0.01 and ***P<0.001 (two-tailed paired t-test with pre-assigned littermate pairs (A, B, D, E) or one-way ANOVA with Dunnett's multiple comparison post-test comparing all columns to control miRNA mimic-transfected miR-18Δ/Δ CD4+ T cells (C)). Data are pooled from two independent experiments, each with three mice per genotype (A, B, C) or are representative of two independent experiments with three mice per group (D, E). Error bars represent s.e.m.

