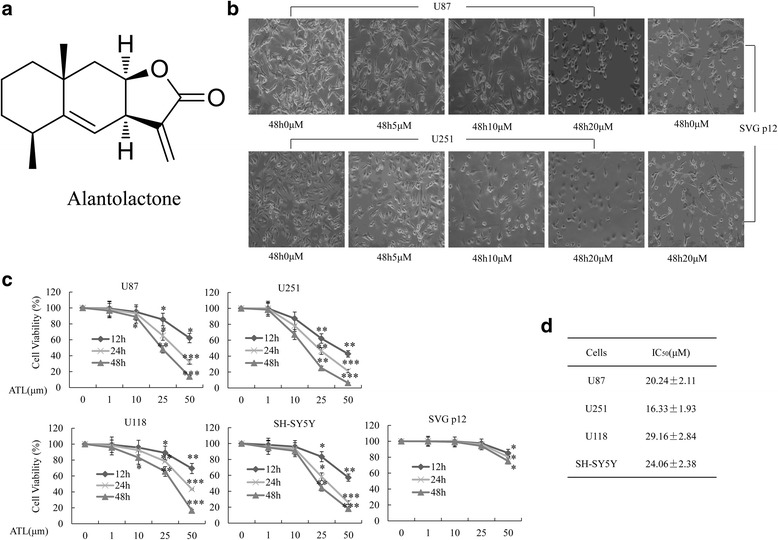
Fig. 1.

ATL changes morphology and inhibits cell viability. a: The chemical structure of ATL. b: Changes in the cell morphology and proliferation of U87, U251 and SVG p12 cells were observed after treatment with ATL for 48 h (original magnification, 200×). c: U87, U251, U118, SHSY-5Y and SVG p12 cells were cultured with the indicated concentrations of ATL for the indicated hours; then, MTT assays were performed. d: At 48 h after treatment, cell viability was determined using MTT assays in the indicated cell lines, and the IC50 value was calculated. The data are shown as the mean ± SD. *P < 0.05, **P < 0.01, vs. the DMSO-treated group
