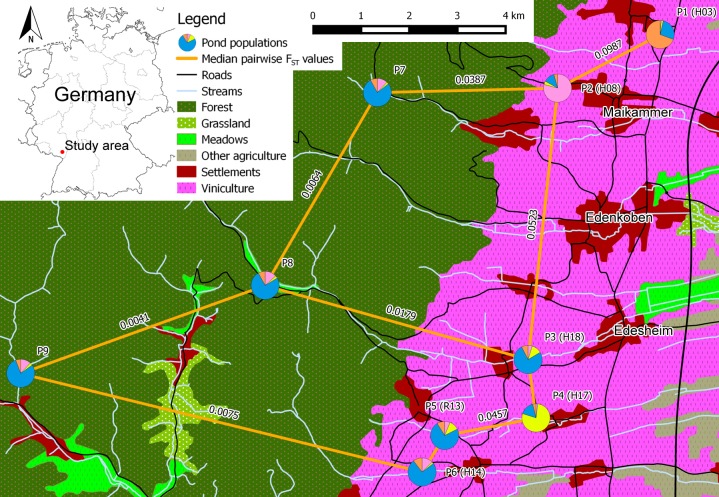
Figure 1. Schematic overview of the core study area in southern palatinate between “Neustadt an der Weinstraße” (north of P1) and “Landau in der Pfalz” (south of P6) with median pairwise FST values for selected pond population pairs.
Pond labels of Lenhardt et al. (2013) in brackets. Pie charts of the pond populations show the overall share of each cluster on the population, based on the STRUCTURE analysis for clusters K = 4 (see Fig. 2 for cluster colors in pie charts).

