
Figure 10. Abbott et al.’s (2010) method of dominance classification.
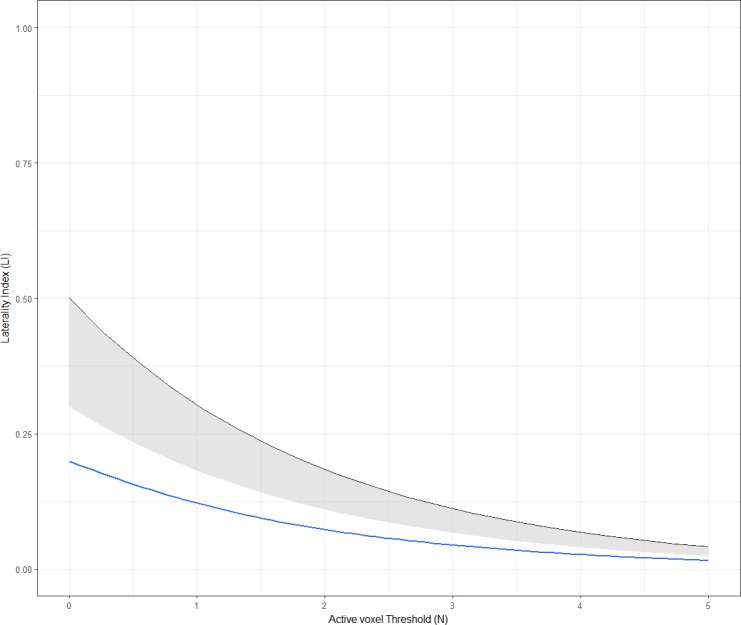
The laterality curve of the subject (blue) is compared to that of a normative control group (black), using the lower 95% confidence interval for the control group (represented by the shaded area). Figure created by Paul A. Thompson, used with permission.