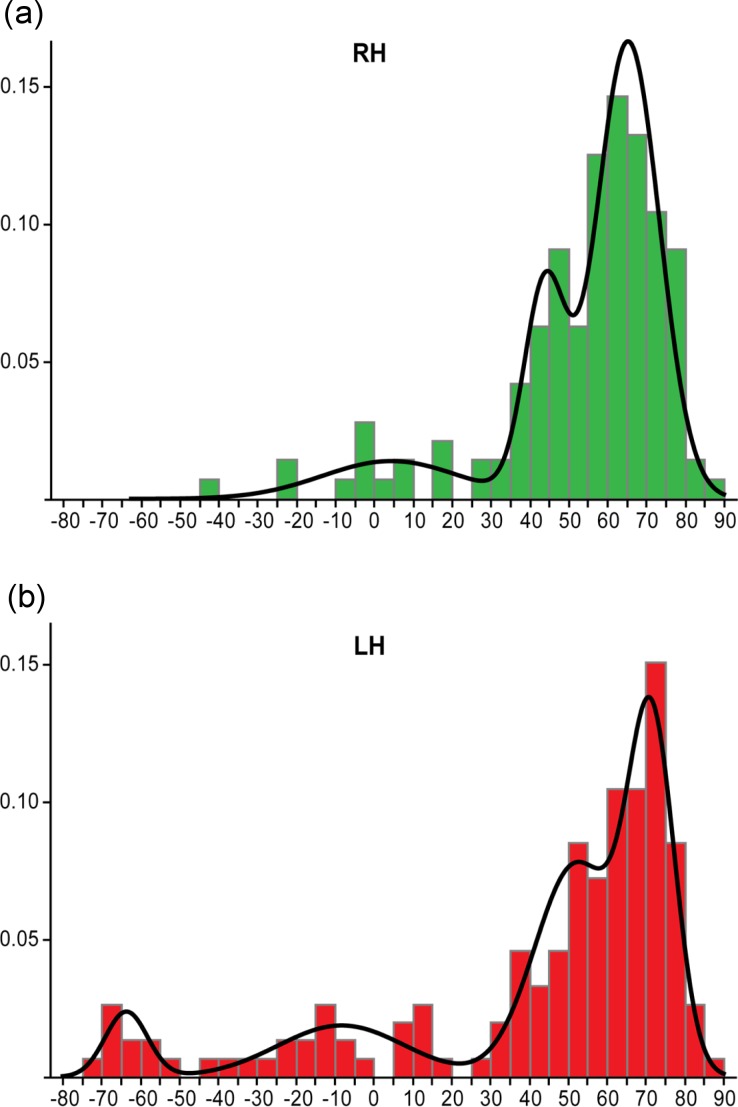
Figure 11. Mazoyer et al.’s (2014) method of dominance classification.
Histograms showing the distribution of LI values across samples of right handed (A) and left handed (B) individuals, with the envelope showing the Gaussian functions fitted to the data for determination of dominance groups. Reprinted from Mazoyer et al. (2014).

