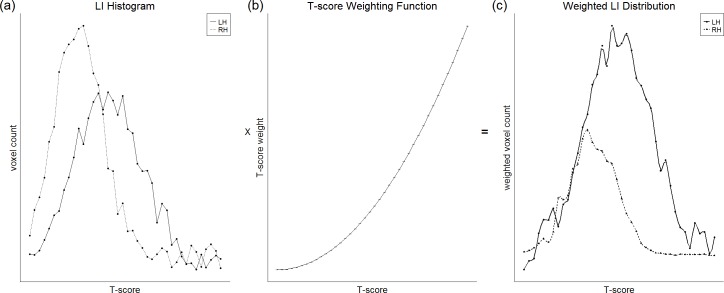
Figure 5. Illustration of the t-weighting method.
A plot of voxel count as a function of t-score threshold (A) is multiplied with a weighting function (B) in which higher thresholds are given greater weight, to obtain a weighted distribution (C). The integrated areas under the right and left hemisphere curves can then be used for the standard LI equation. Figure created by Paul A. Thompson, used with permission.

