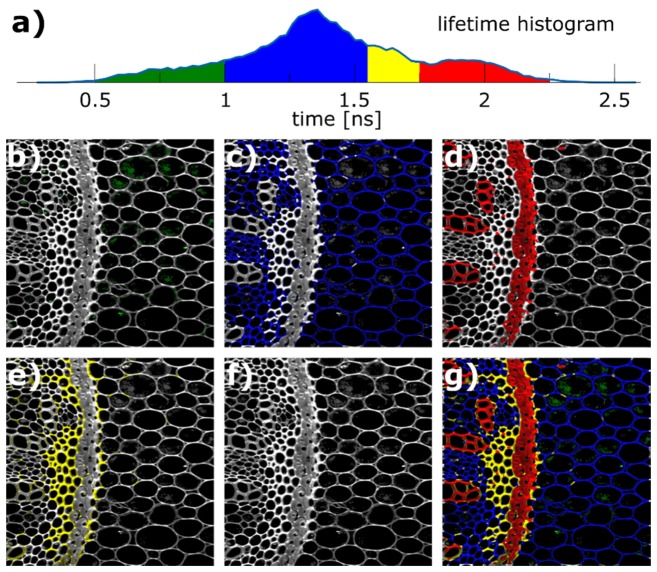
Fig. 5.
Individual colorings of different lifetime regions of Fig. 4 b). 512 × 512 pixel, 1 MHz pixel rate, 4 × averaged, total acquisition time 2.7 s. a) Lifetime histogram over all pixels. b) - e) Individually colored areas distinguished by different lifetime bins representing various functional sites of the plant stem. f) TPEF intensity. g) Overlay of colored images.

