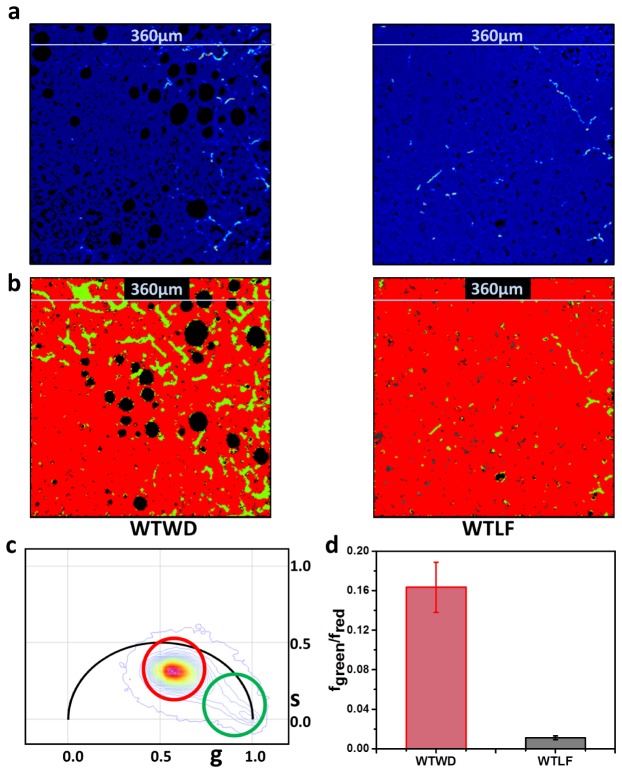
Fig. 4.
Imaging and quantification of fibrosis in mouse liver as a function of diet. (a) Intensity images in the SHG channel and (b) Color coded images of liver tissues from WD and LF mice are shown according to the cursor selection in (c). The green colors show region of the image displaying SHG generation from collagen I and the red shows bleed-through autofluorescence originating from rest of the tissue. Black spots are regions lacking autofluorescence. This is due to the paraffin sectioning of these tissues where the fat droplet gets dissolved in the paraffin. The signal from LLS is absent in these images and appear as black holes. (c) Phasor plot used to separate the coherent SHG signal (green cursor, lifetime of zero) and the bleed-through autofluorescence (red cursor, non-zero lifetime) and color the FLIM images accordingly. (d) The ratio of the area covered by SHG (fgreen) (green) to the area covered by bleed through autofluorescence (red, fred). The higher value of the ratio correlates with advanced fibrosis. The average over all animals is presented here with the standard error of the mean as the error bar. Six animals of each type were measured and eight images were measured for each animal. The p value for the paired sample t-test for panel d was less than 0.0001.

