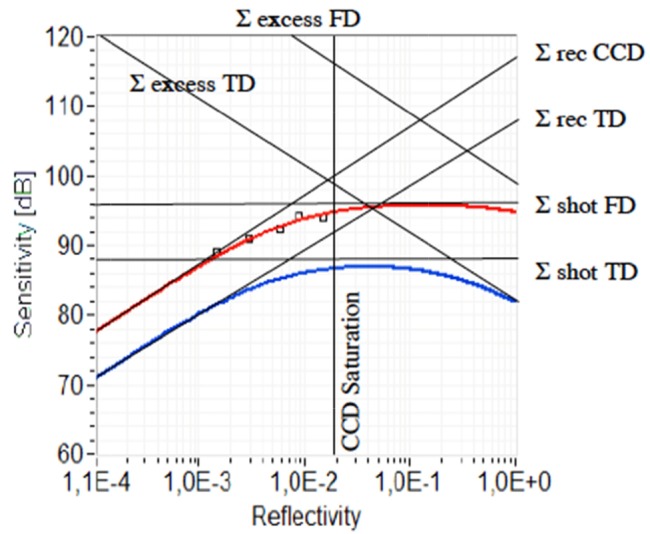
Fig. 4.

The red line shows the theoretical sensitivity Σ for FD-OCT, employing a CCD sensor, according to Eq. (16) with Pref = 0.15P0, Psample = 0.07 P0, ρ = 0.19, η = 0.4, P0 = 175μW, τi = 1 ms, σr + d = 250 e-(at room temperature), FWC = 400 ke- The blue line is the TD-OCT sensitivity for an unbalanced configuration, with Pref = 0.25 P0, B = 113 kHz, NEC = 0,5pA/√Hz. The squared dots are the actual measured system sensitivities. (reproduced from Leitgeb et al. [14]). The saturation of the CCD sets the ultimate limit to the achievable sensitivity in SD-OCT.
