
Fig. 10.
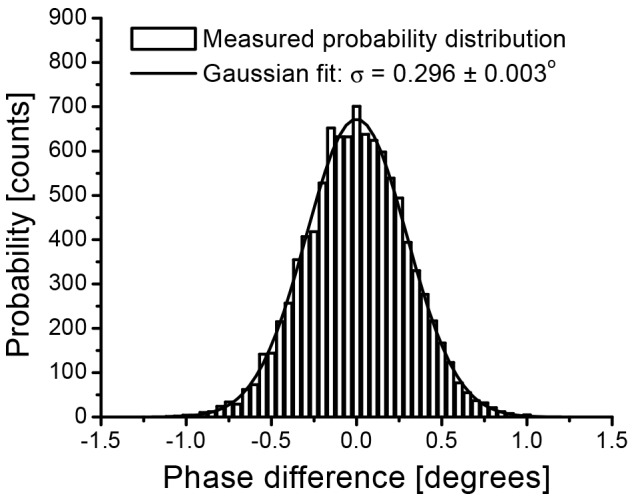
Probability distribution of the measured phase difference between adjacent A-lines in SD-OCT, with a stationary reflector in the sample arm. Bars: Counted phase difference for 9990 A-lines. Bin size = 0.05°. Solid line: Gaussian fit to the distribution, with a measured standard deviation of 0.296 ± 0.003°. Reproduced from Ref [25]. with permission from the Optical Society of America.