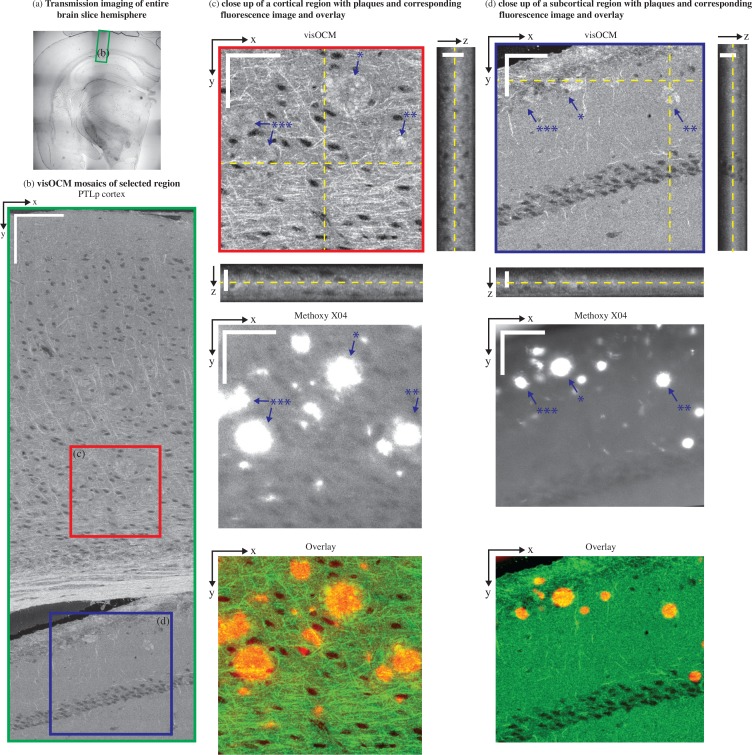
Fig. 6.
ex-vivo imaging of cortical and subcortical structures in a 5xFAD mouse brain slice. (a) A transmission image shows the location of the area where a visOCM image mosaic was obtained (b). The visOCM mosaic reveals fibers, cells and amyloid plaques in both cortical and subcortical structures. Close-ups of areas of interest containing amyloid plaques, in both cortical and subcortical regions, are displayed with their en-face views and corresponding fluorescence image (c–d). Both images are overlayed with the visOCM and the fluorescence in green and red respectively. In the visOCM image, plaques can be seen as irregular high intensity regions (a depth scan of (c) is shown in Visualization 3 (10.2MB, AVI) ). Scalebars: 150 μm in (b), 50 μm in the en-face and 20 μm m in the orthogonal views of (c–d).

