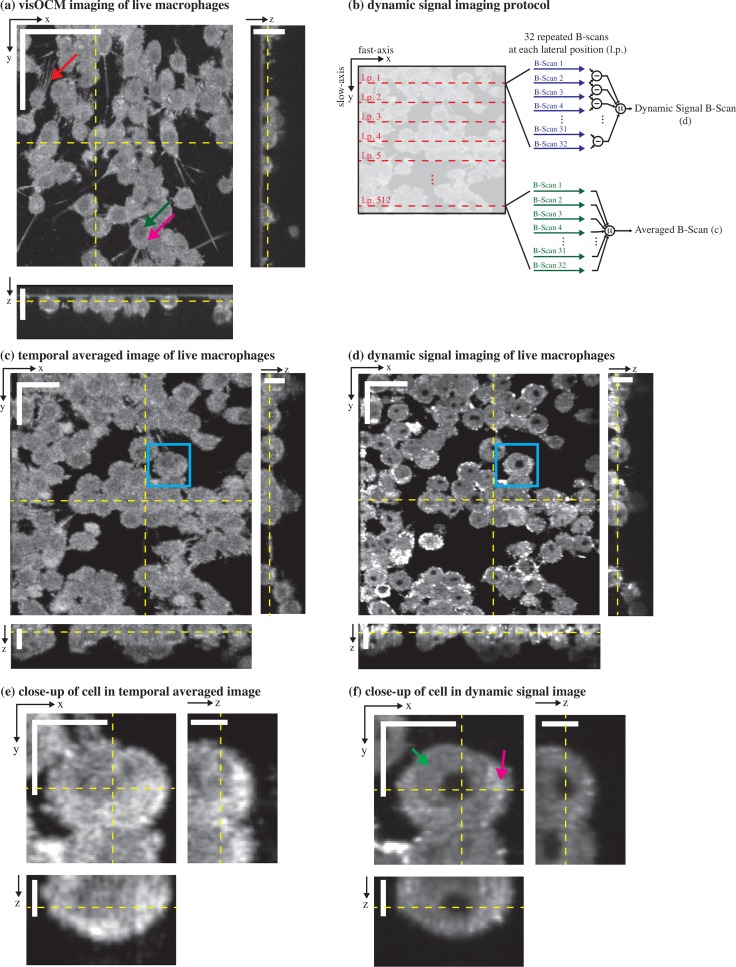
Fig. 7.
visOCM imaging of murine macrophages. (a) A mosaic of macrophages obtained with visOCM with its orthogonal views reveals the three-dimensional organisation of cells in a culture. Cellular components can be observed such as the filopodia (pointed by the red arrow), the nucleus (pointed by the green arrow) and the cytoplasm (pink arrow). We further explored the capabilities of visOCM by applying a protocol similar to OCT angiography (b). The protocol entails imaging each lateral position along the slow axis 32 times (32 repeated B-scans per location). These 32 B-scans are either averaged or undergo a point-wise complex subtraction to obtain an averaged image (c) or a view of the dynamic components of the tomogram (d) respectively. The averaged image is identical in contrast to (a), whereas the dynamic signal image further reveals compartments within the cell (cytoplasm pointed in pink and nucleus in green), as either darker or brighter subregions (d) Close-ups of a selected cell in (c) and (d) are shown in (e) and (f) respectively, highlighting the differences in contrast between the averaged and dynamic images. Scalebars: 50 μm in the en-face view in (a), 20 μm in the orthogonal views in (a) and in the en-face views of (c–d), 10 μm in the orthogonal views in (c–d) and in the en-face views of (e–f), 5 μm in the orthogonal views in (e–f).

