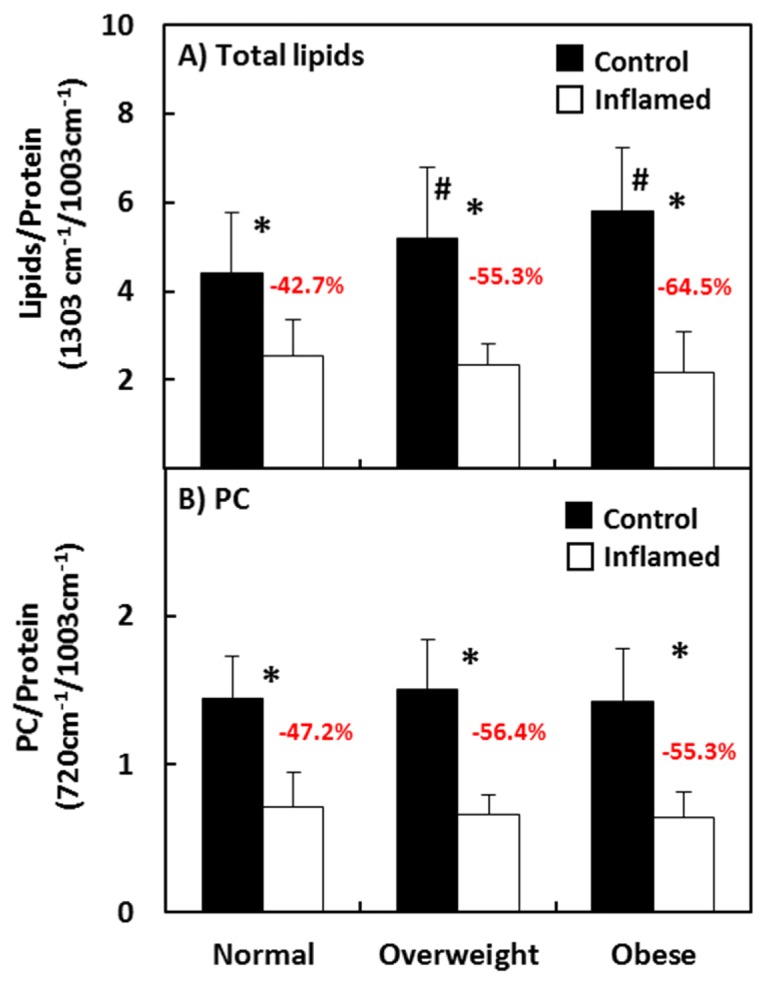
Fig. 5.

Comparison of lipids and PC content between control and inflamed colon tissue for different BMI categories. The percentage of decreases in the inflamed groups compared to the BMI-matched controls are marked on the figure. *p < 0.001 comparison of control and inflamed tissue; p < 0.05 comparison of overweight or obese control and normal-weighted control.
