
Fig. 2.
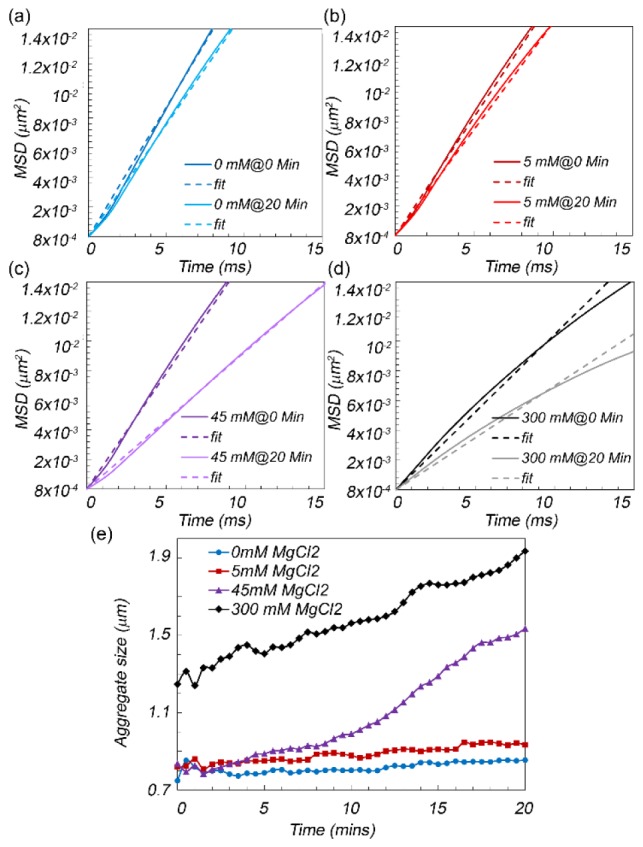
(a-d) Mean square displacement (MSD) curves of aggregating polystyrene microspheres at 0 and 20 minutes after adding the MgCl2 at 0, 5, 45, and 300 micromolar concentrations, respectively. The linear fits are also displayed with dashed lines. Clearly, the slope of MSD curves decreased following salt addition and this was more pronounced in higher salt concentrations, due to significantly faster aggregation and larger aggregate sizes. (e) Microsphere aggregate size as a function of time following the addition of salt. The aggregation rate and aggregate size increases with salt concentration.