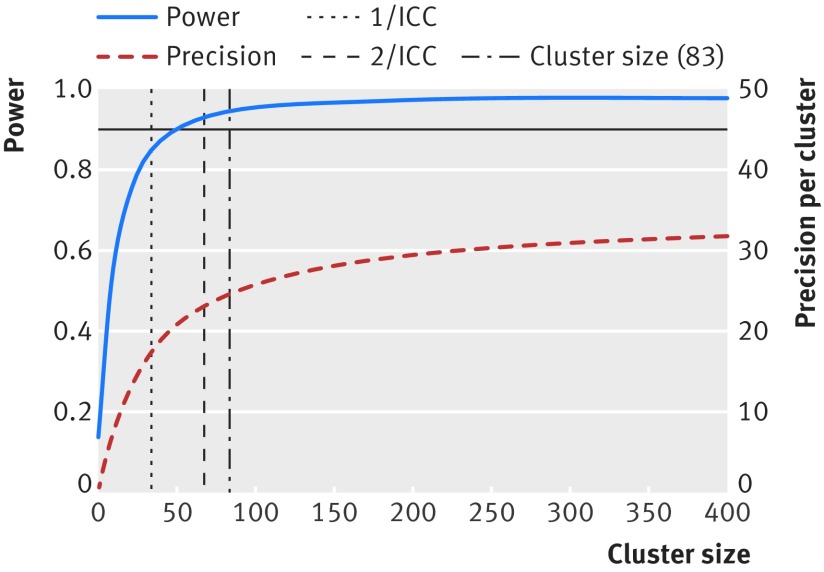
Fig 1 Power and precision curves for case study with an ICC of 0.03. Curves show increases in power (blue line) and precision (red line) as cluster size increases. Assumes a CRT with 10 clusters in each arm, designed to detect a difference between two proportions 0.6 and 0.45 at a two sided significance level of 5%.

An official website of the United States government
Here's how you know
Official websites use .gov
A
.gov website belongs to an official
government organization in the United States.
Secure .gov websites use HTTPS
A lock (
) or https:// means you've safely
connected to the .gov website. Share sensitive
information only on official, secure websites.
