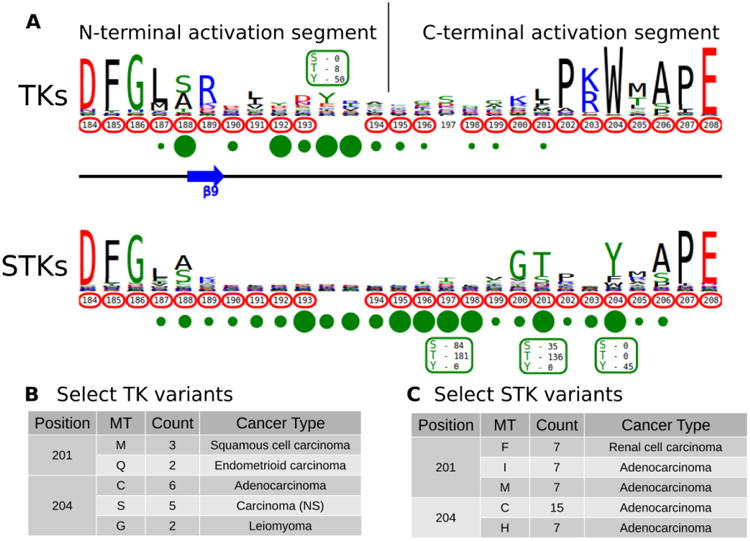
Figure 2.

A) KinView comparison of PTK and STK activation segments. The natural sequence variation is displayed in a weblogo format, with cancer variants represented with red circumscribed residue numbers and post-translational modifications represented with green circles. Major phosphorylation sites have the residue type and number of experimentally validated phosphorylation events displayed. Note, the lack of residue numbers below two columns reflect a deletion in PKA relative to the alignment profiles. B) A subset of cancer associated variants in PTKs. Here, we show the common variants effecting positions 201PKA and 204PKA in PTKs. The mutant type (MT), count and most commonly associated cancer type are shown. C) A subset of cancer associated variants in STKs. Here, we show the common variants effecting positions 201PKA and 204PKA in STKs. The mutant type (MT), count and most commonly associated cancer type are shown.
