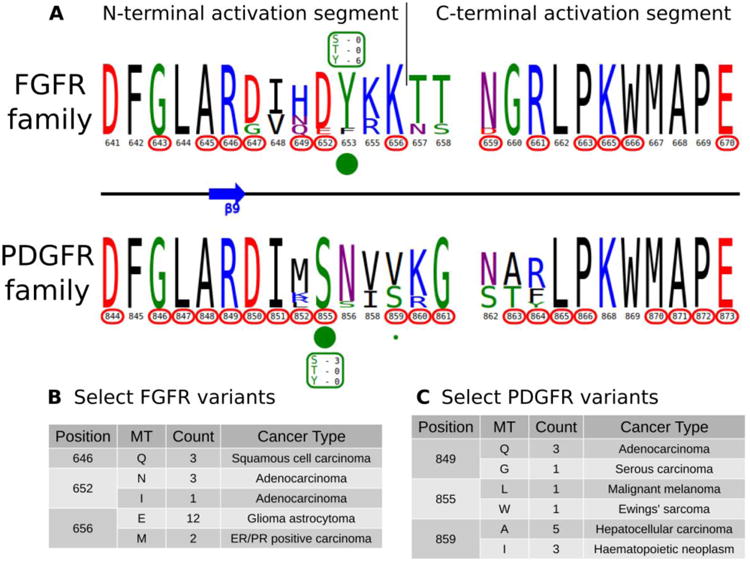
Figure 5.

A) KinView comparison of FGFR family and PDGFR family activation segments. The natural sequence variation is displayed in a weblogo format, with cancer variants represented with red circumscribed residue numbers and post-translational modifications represented with green circles. Major phosphorylation sites have the residue type and number of experimentally validated phosphorylation events displayed. B) A subset of cancer associated variants in FGFR family. Here, we show the common variants effecting positions 646FGFR1, 652FGFR1 and 656FGFR1 in the FGFR family. The mutant type (MT), count and most commonly associated cancer type are shown. Note the high frequency of K656EFGFR1 variants, which structurally mimic the phosphorylation of the preceding tyrosine. C) A subset of cancer associated variants in PDGFR family. Here, we show the common variants effecting positions 849PDGFRβ, 855PDGFRβ and 859PDGFRβ in the PDGFR family. The mutant type (MT), count and most commonly associated cancer type are shown.
