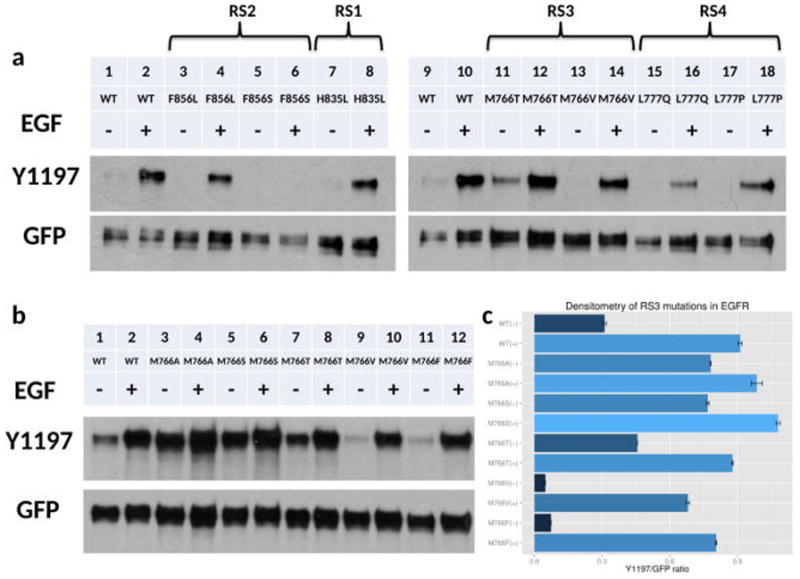
Figure 2.

Western blot analyses and screening of RS3 mutations in EGFR. (a) Lanes from left to right: WT EGFR (−), WT EGFR (+), F856L (−), F856L (+), F856S (−), F856S (+), H835L (−), H835L (+), WT EGFR (−), WT EGFR (+), M766T (−), M766T (+), M766V (−), M766V (+), L777Q (−), L777Q (+), L777P (−), L777P (+). − and + indicate the absence and presence of EGF stimulation. (b) Series of mutations at RS3 residue. Lanes from left to right: WT EGFR (−), WT EGFR (+), M766A (−), M766A (+), M766S (−), M766S (+), M766T (−), M766T (+), M766V (−), M766V (+), M766F (−), M766F (+). − and + indicate the absence and presence of EGF stimulation. (c) Densitometry of three independent experiments of RS3 residue mutations.
