
Figure 4.
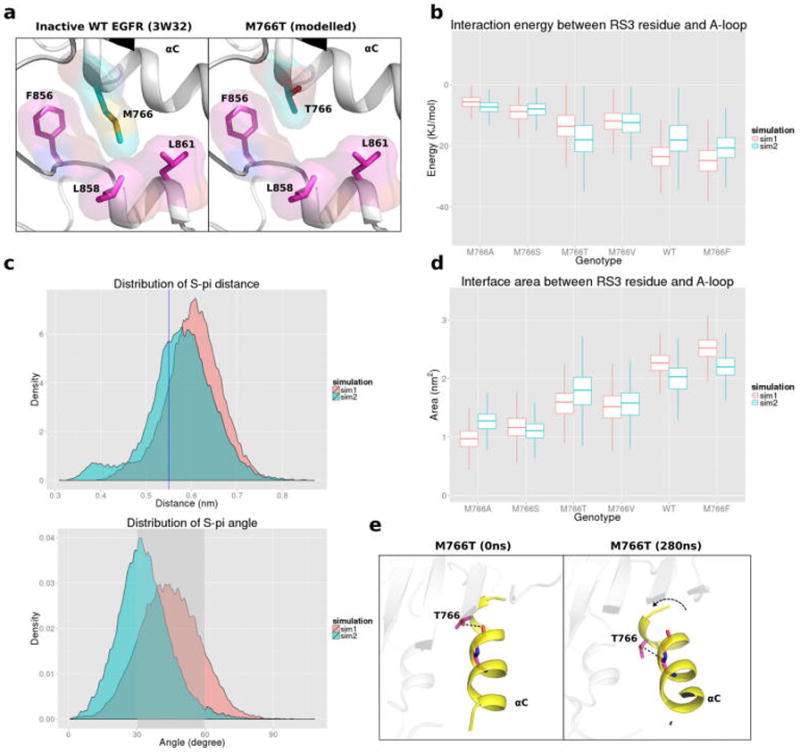
(a) Packing interaction between M766 in the αC-helix and hydrophobic residues in the activation loop. (b) Boxplot representing potential (VDW and couloumbic) interaction energy distributionbetween RS3 residue and A-loop helix. Distribution quantile (5%, 25%, 50%, 75%, and 95%) is shown in each vertical box plot. (c) Distance distribution of of M766 sulfur atom and the center of F856 benzyl group (upper panel) and angle distribution of M766 sulfur atom and the normal vector of F856 benzyl group (bottom panel). Blue line or shaded area indicate optimal interaction region. (d) Boxplot representing the surface area between RS3 residue and A-loop in different RS3 mutations. (e) MD snapshots showing the intrahelix hydrogen bonding interactions between the hydroxyl group of T766 and carbonyl oxygen of E762 or A763, resulting in a bent αC-helix conformation.