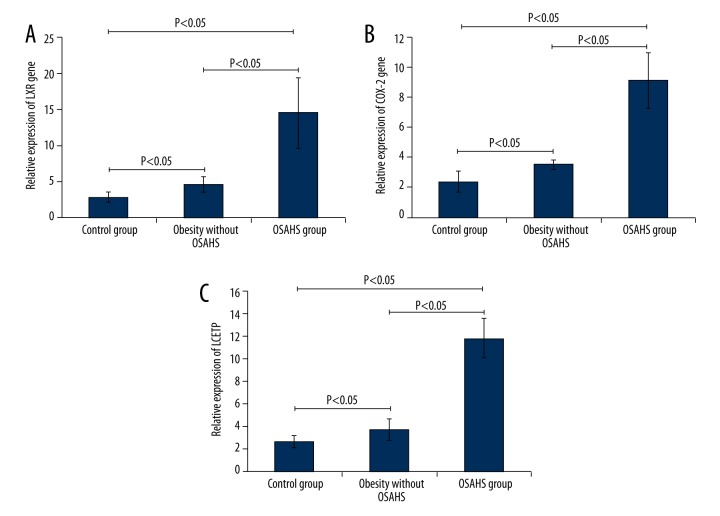
Figure 1.
Observation of the expression of LXR, COX-2, and CETP in the control group, the obesity without OSHAS group, and the OSHAS group. (A) Expression of LXR gene in each group. (B) Expression of COX-2 gene in each group. (C) Expression of CETP gene in each group. * P<0.05 indicates that there were significant differences in the gene expression between the marked two groups.

