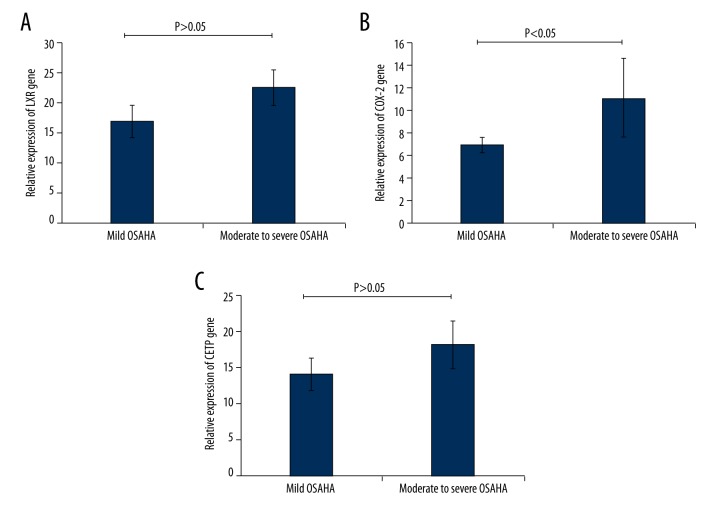
Figure 2.
Detection of the expression of LXR, COX-2, and CETP in the mild OSAHS group and the moderate or severe OSAHS group. (A) Expression of the LXR gene in the mild OSAHS group and the moderate or severe OSAHS group. (B) Expression of the COX-2 gene in the mild OSAHS group and the moderate or severe OSAHS group. (C) Expression of the CETP gene in the mild OSAHS group and the moderate or severe OSAHS group. * P<0.05 indicates that there were significant differences in the gene expression between the marked two groups.

