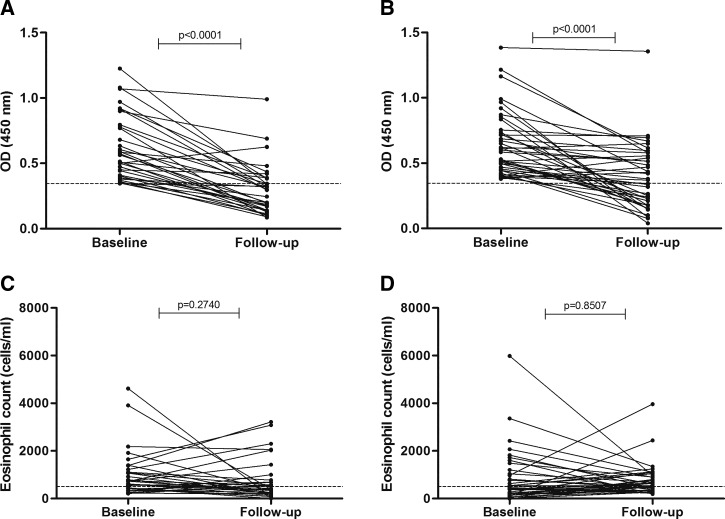
Figure 2.
Comparison of base line and follow up. Serum anti-NIE values (OD) in (A) G1 (MDA + W and S) (N = 33) and (B) G2 (MDA alone) (N = 40), the dashed line represents the cutoff value. Absolute eosinophil count before and after treatment in (C) G1 and (D) G2. GI = Group 1; G2 = Group 2; MDA = massive drug administration; OD = optical density; W and S = water and sanitation facilities.

