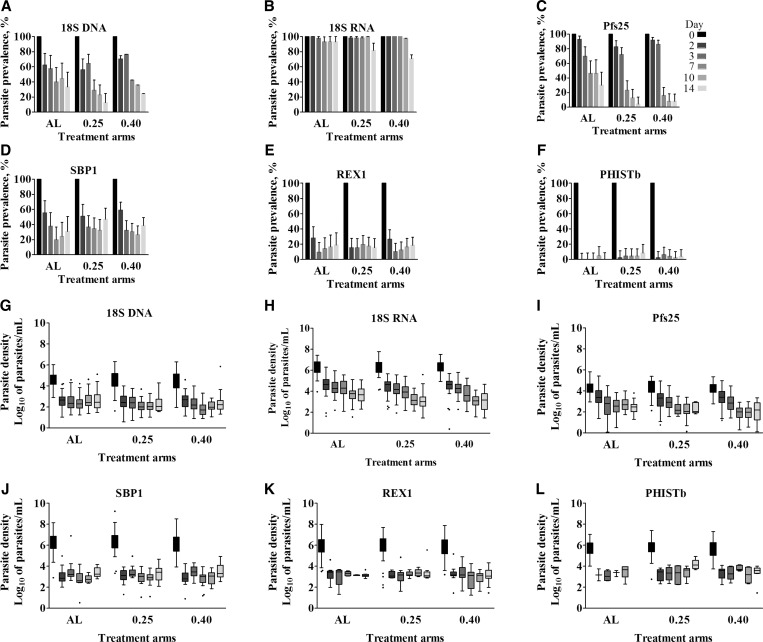
Figure 2.
Parasite carriage and stage composition of clinical malaria trial samples. Prevalence of (A–B) total parasites, (C) gametocytes, and (D–F) asexual parasites in the three treatment arms is presented. Bar graphs indicate relative prevalence of the targets with regard to the baseline signal on day 0 vs. days 2, 3, 7, 10, and 14 after initiation of treatment. (G–L) Box plots in the lower panel indicate the median, 25th and 75th percentile parasite densities (Log10 parasites/mL) of the markers in the three treatments arms. Whiskers indicate the 5th and 95th percentiles. The three treatment groups are presented on the x axis: AL = only artemether–lumefantrine, 0.25 = artemether–lumefantrine + 0.25 mg/kg primaquine, and 0.40 = Arthermer Lumefantrine + 0.40 mg/kg primaquine. Shading of bars and whiskers indicates days since the start of treatment (days 0–14), dark to light colors. Error bars indicate the upper limit of the 95% confidence interval of a binomial distribution.

