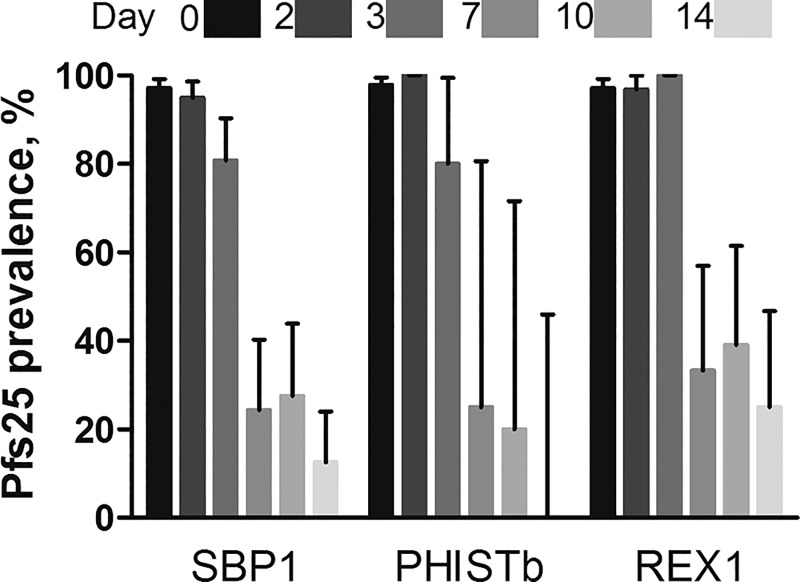
Figure 3.
Pfs25 prevalence in samples obtained at the different time points that were positive for skeleton-binding protein 1 (SBP1), ring-exported protein 1 REX1, or PHISTb. Bar graphs indicate the relative gametocytes signal on day 0 vs. days 2, 3, 7, 10, and 14 after initiation of treatment among samples that were found positive with the three targets. Shading of bars indicates days since the start of treatment (days 0–14), dark to light colors. Error bars indicate the upper limit of the 95% confidence interval of a binomial distribution.

