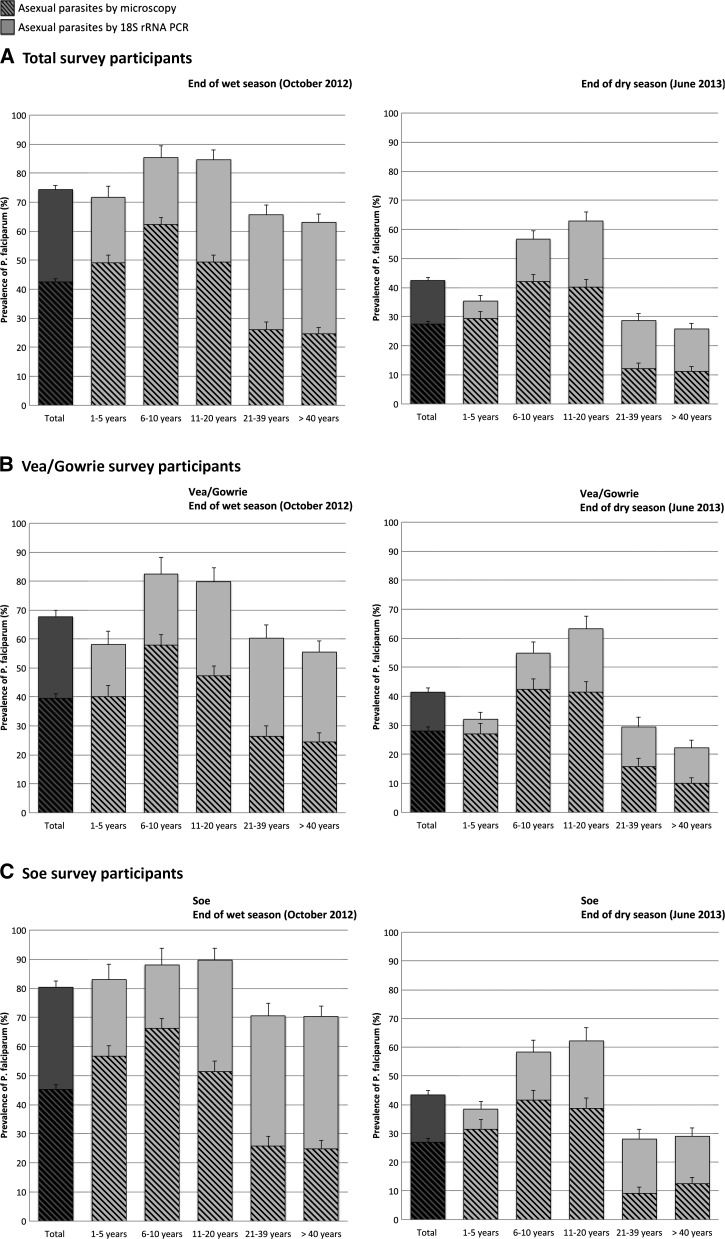
Figure 2.
Asymptomatic Plasmodium falciparum prevalence as determined by microscopy and 18S rRNA polymerase chain reactions (PCR) in relation to age group and survey/season. Hatched bars indicate individuals with microscopically detectable P. falciparum parasites; and solid bars, submicroscopic P. falciparum parasites detected by 18S rRNA PCR. The darker hatched and solid bars represent the data for the total number of participants surveyed.(A) Prevalence among all participants surveyed in Bongo District. (B) Prevalence among participants surveyed in Vea/Gowrie. (C) Prevalence among participants surveyed in Soe. Error bars represent the upper limits of the 95% confidence interval (CI).

