
Figure 3. Cancer cell-specific cellular uptake of HSA-FCBL and its intracellular distribution.
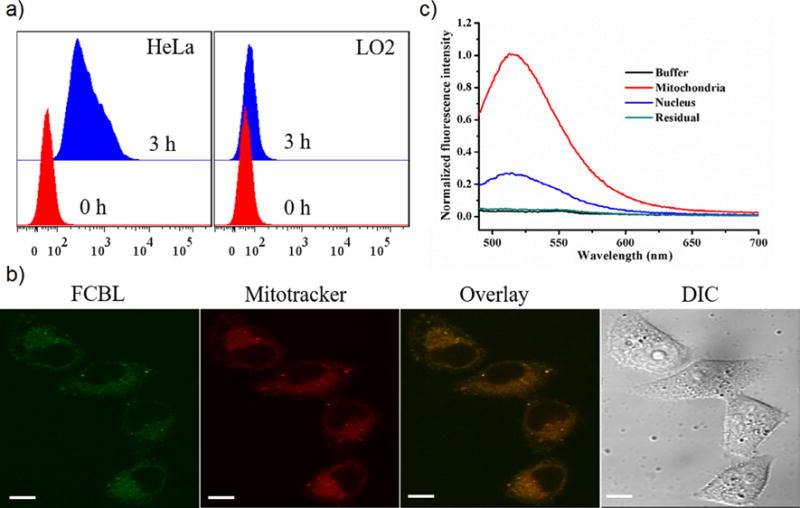
(a) Cellular uptake analysis of the HSA-FCBL in HeLa and LO2 cells after 3-h incubation. (b) Fluorescence analysis of FCBL in equivalent nuclear extracts, mitochondrial extracts and intracellular residual of HeLa cells. (c) CLSM analysis of HeLa cells incubated with HSA-FCBL after 3-h incubation. Mitochondria costained with MitoTracker® Deep Red FM. The scale bar was 10 μm.