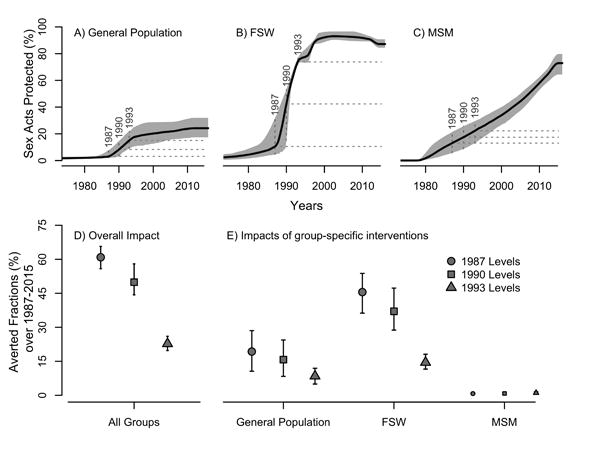
Figure 2. Historical trends in condom use and estimated averted fractions (AF) of HIV infections over 1987-2015 in Cote d'Ivoire, according to different counterfactual scenarios.

The proportion of sex acts protected by condom estimated from data (Table S5) is shown for A) the general heterosexual population excluding women engaged in sex-work (displayed trends are a weighted average of each age-class specific trends), B) female sex workers (FSW), and C) men who have sex with men (MSM). Dashed horizontal lines represented the three counterfactuals scenarios of condom use trends assumed to derive the AF, corresponding to constant levels from 1987, 1990, and 1993 onward. Panel D) shows AF estimates of increases in condom use by all risk groups for each counterfactual. In panel E) AF due to condom use increases in specific risk group are presented (general heterosexual population not engaging in sex work only, by FSW only, and by MSM only). For these, each AF estimates assumed that condom has not increased in the other risk groups (i.e. condom use remained at their counterfactual levels). Median and 95% credible intervals of the posterior estimates are shown.
